机器学习-分类问题B 数学公式在渲染器中会出现错误,目前还没有解决
Outline
Nonlinear classifiers
Kernel trick and kernel SVM
Ensemble Methods - Boosting, Random Forests Classification Summary
1 2 3 4 5 6 7 8 9 10 %matplotlib inline import matplotlib_inline matplotlib_inline.backend_inline.set_matplotlib_formats('retina' ) import matplotlib.pyplot as pltplt.rcParams['figure.dpi' ] = 100 import matplotlibfrom numpy import *from sklearn import *from scipy import stats
1
2
3
4
5
6
7
8
9
10
11
12
13
14
15
16
17
18
19
20
21
22
23
24
25
26
27
28
29
30
31
32
33
34
35
36
37
38
39
40
41
42
43
44
45
46
47
48
49
50
51
52
53
54
55
56
57
58
59
60
61
62
63
64
65
66
67
68
69
70
71
72
73
74
75
76
def drawstump (fdim, fthresh, fdir='gt' , poscol=None , negcol=None , lw=2 , ls='k-' ): if fdir == 'lt' : tmp = poscol poscol = negcol negcol = tmp polyxn = [fthresh, fthresh, -30 , -30 ] polyyn = [30 , -30 , -30 , 30 ] polyxp = [fthresh, fthresh, 30 , 30 ] polyyp = [30 , -30 , -30 , 30 ] if (poscol): if fdim==0 : plt.fill(polyxp, polyyp, poscol, alpha=0.2 ) else : plt.fill(polyyp, polyxp, poscol, alpha=0.2 ) if (negcol): if fdim==0 : plt.fill(polyxn, polyyn, negcol, alpha=0.2 ) else : plt.fill(polyyn, polyxn, negcol, alpha=0.2 ) if fdim==0 : plt.plot(polyxp[0 :2 ], polyyp[0 :2 ], ls, lw=lw) else : plt.plot(polyyp[0 :2 ], polyxp[0 :2 ], ls, lw=lw) def drawplane (w, b=None , c=None , wlabel=None , poscol=None , negcol=None , lw=2 , ls='k-' ): if c != None : b = -sum (w*c) if (abs (w[0 ])>abs (w[1 ])): x0 = array([-30 ,30 ]) x1 = -w[0 ]/w[1 ] * x0 - b / w[1 ] else : x1 = array([-30 ,30 ]) x0 = -w[1 ]/w[0 ] * x1 - b / w[0 ] if (poscol): polyx = [x0[0 ], x0[-1 ], x0[-1 ], x0[0 ]] polyy = [x1[0 ], x1[-1 ], x1[0 ], x1[0 ]] plt.fill(polyx, polyy, poscol, alpha=0.2 ) if (negcol): polyx = [x0[0 ], x0[-1 ], x0[0 ], x0[0 ]] polyy = [x1[0 ], x1[-1 ], x1[-1 ], x1[0 ]] plt.fill(polyx, polyy, negcol, alpha=0.2 ) lineplt, = plt.plot(x0, x1, ls, lw=lw) if (wlabel): xp = array([0 , -b/w[1 ]]) xpw = xp+w plt.arrow(xp[0 ], xp[1 ], w[0 ], w[1 ], width=0.01 ) plt.text(xpw[0 ]-0.5 , xpw[1 ], wlabel) return lineplt
Ensemble Classifiers
AdaBoost - Adaptive Boosting
Base classifier is a “weak learner”
A simple classifier that can be slightly better than random chance (>50%)
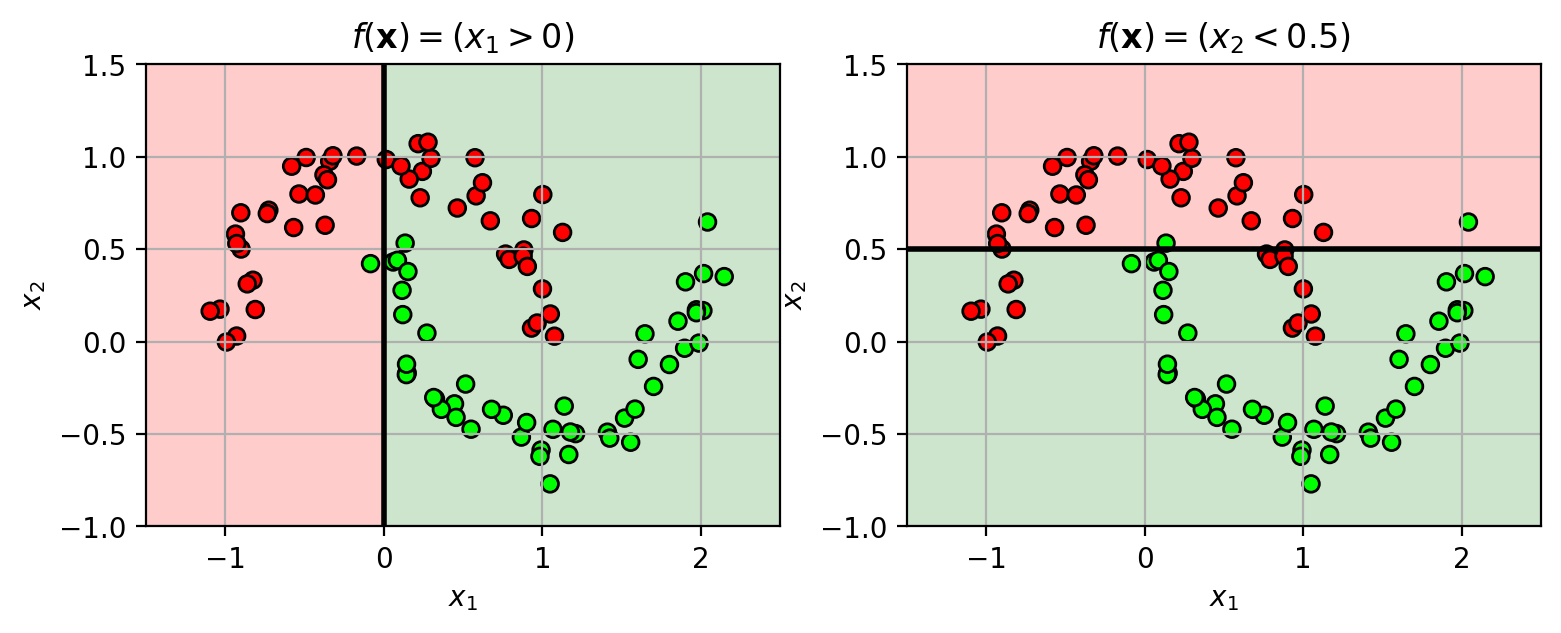
Example: decision stump classifier
check if feature value is above (or below) a threshold.
$y = h(x) = \begin{cases}+1, & x_j \geq T \ -1, & x_j\lt T \end{cases}$
1 2 3 4 5 6 7 8 9 10 11 12 13 14 15 16 17 18 19 20 21 22 23 24 from sklearn import datasetsX3,Y3 = datasets.make_moons(n_samples=100 , noise=0.1 , random_state=4487 ) mycmap = matplotlib.colors.LinearSegmentedColormap.from_list('mycmap' , ["#FF0000" , "#FFFFFF" , "#00FF00" ]) axbox3 = [-1.5 , 2.5 , -1 , 1.5 ] wlfig = plt.figure(figsize=(9 ,3 )) plt.subplot(1 ,2 ,1 ) drawstump(0 , 0 , poscol='g' , negcol='r' ) plt.scatter(X3[:,0 ], X3[:,1 ], c=Y3, cmap=mycmap, edgecolors='k' ) plt.xlabel('$x_1$' ); plt.ylabel('$x_2$' ); plt.grid(True ) plt.axis(axbox3) plt.title('$f(\mathbf{x}) = (x_1>0)$' ) plt.subplot(1 ,2 ,2 ) drawstump(1 , 0.5 , fdir='lt' , poscol='g' , negcol='r' ) plt.scatter(X3[:,0 ], X3[:,1 ], c=Y3, cmap=mycmap, edgecolors='k' ) plt.xlabel('$x_1$' ); plt.ylabel('$x_2$' ); plt.grid(True ) plt.axis(axbox3) plt.title('$f(\mathbf{x}) = (x_2<0.5)$' ) plt.close()
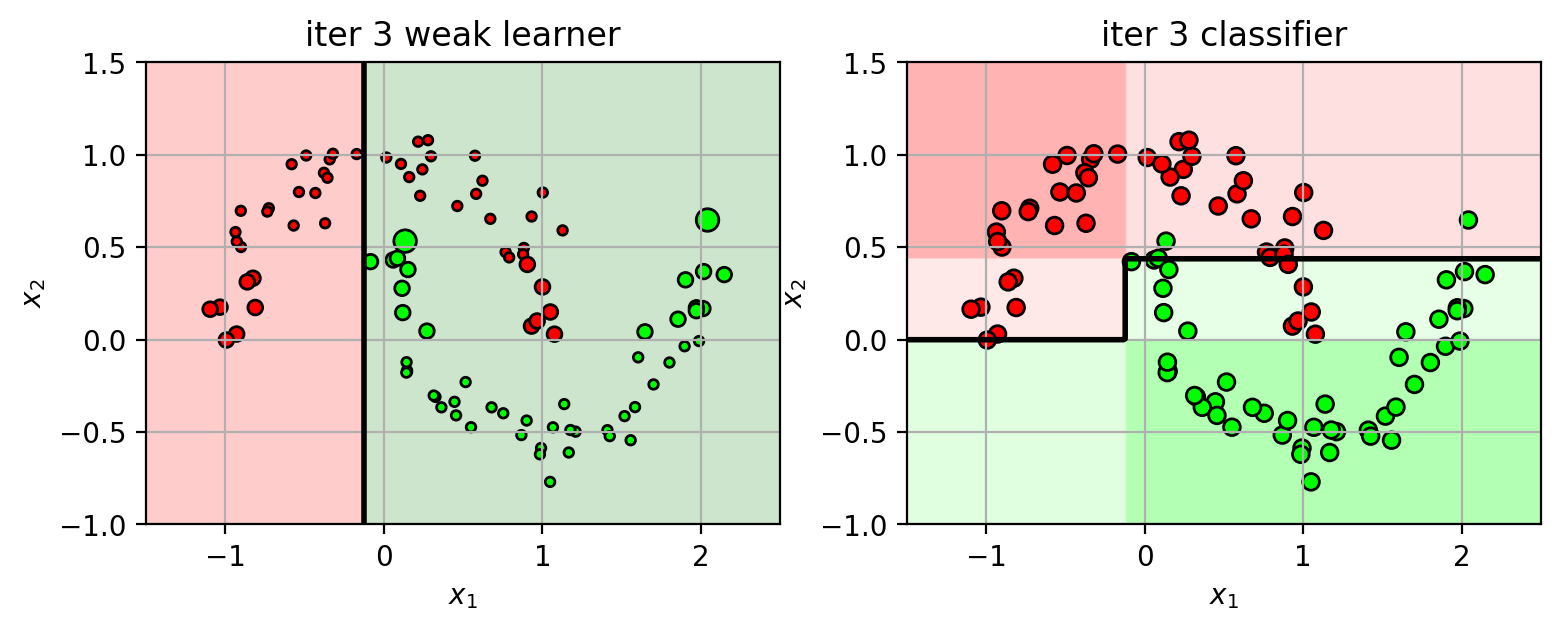
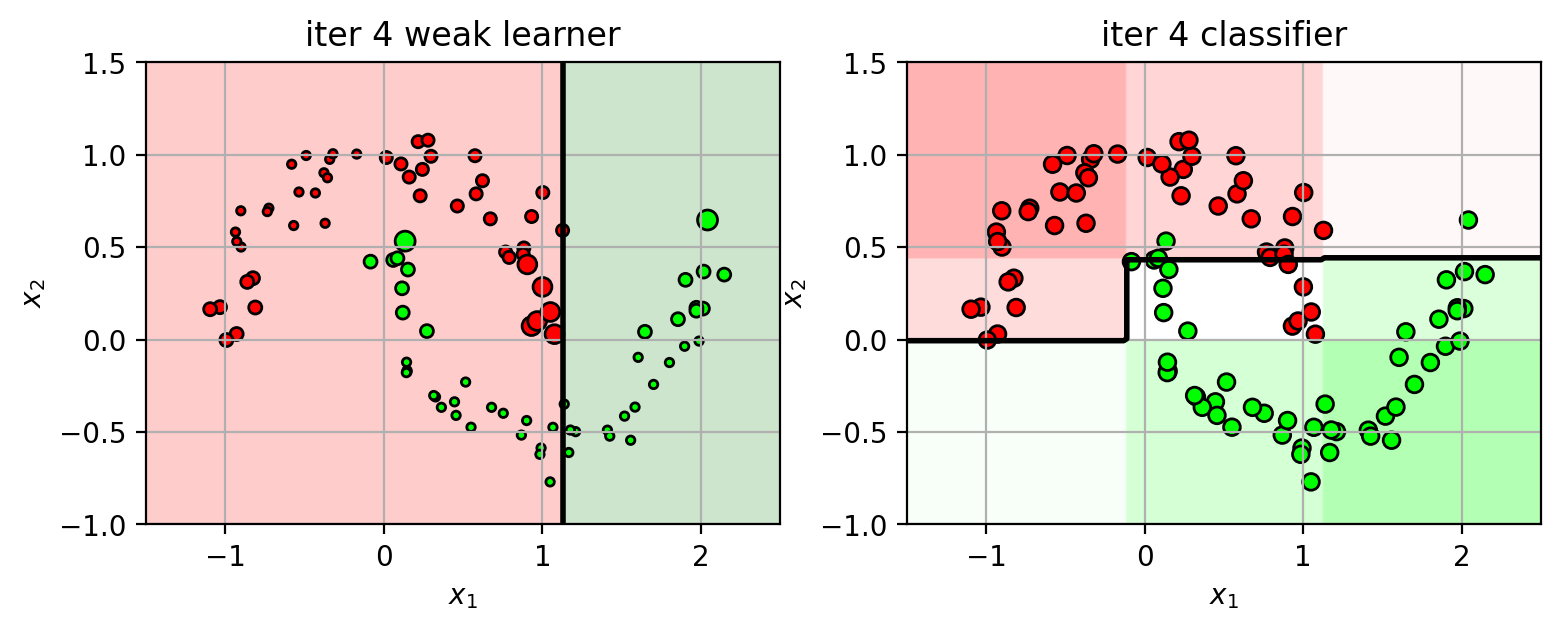
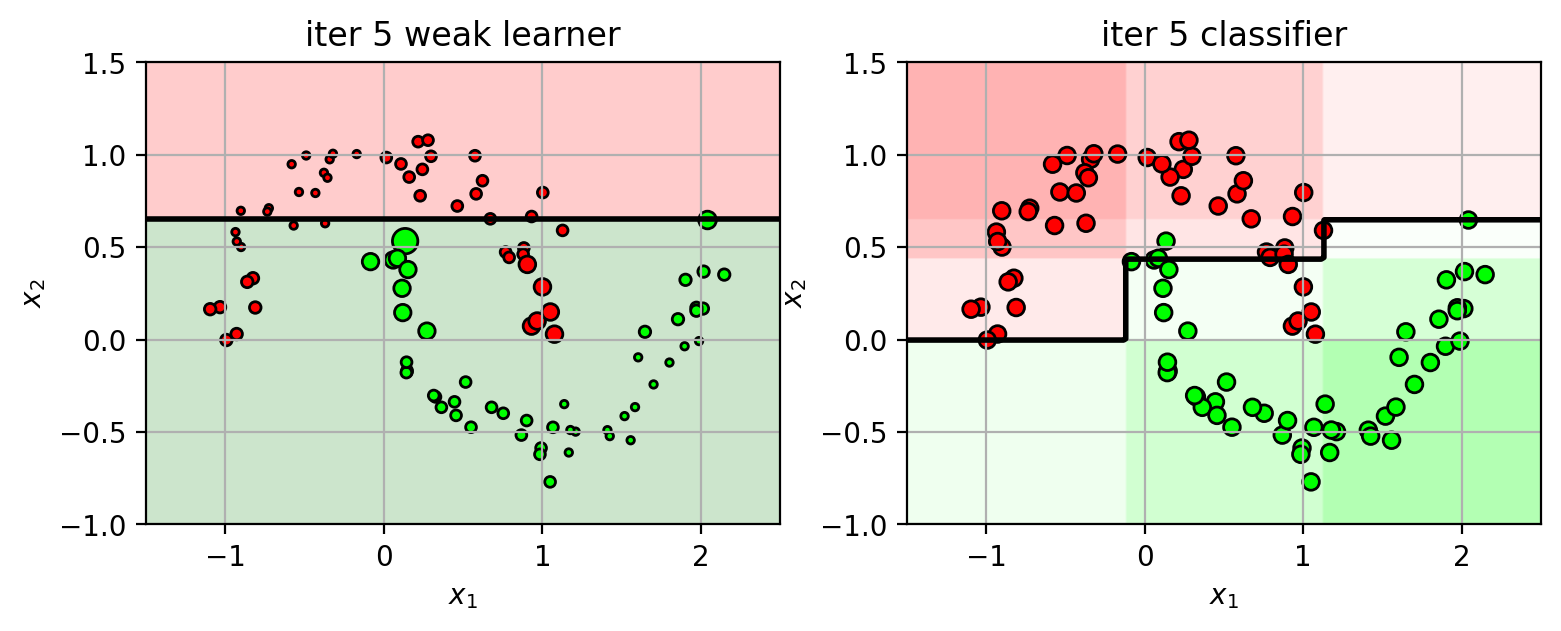
Idea: train weak classifiers sequentiallyIn each iteration,
Pick a weak learner $h_t(\mathbf{x})$ that best carves out the input space.
The weak learner should focus on data that is misclassified.
Apply weights to each sample in the training data.
Higher weights give more priority to difficult samples.
Combine all the weak learners into a strong classifier: $f_t(\mathbf{x}) = f_{t-1}(\mathbf{x}) + \alpha_t h_t(\mathbf{x})$
$\alpha_t$ is a weight for each weak learner.
1
2
3
4
5
6
7
8
9
10
11
12
13
14
15
16
17
18
19
20
21
22
23
24
25
26
27
28
29
def plot_boosting (model, axbox, X ): xr = [ linspace(axbox[0 ], axbox[1 ], 200 ), linspace(axbox[2 ], axbox[3 ], 200 ) ] xgrid0, xgrid1 = meshgrid(xr[0 ], xr[1 ]) allpts = c_[xgrid0.ravel(), xgrid1.ravel()] if hasattr (model, 'decision_function' ): score = model.decision_function(allpts).reshape(xgrid0.shape) else : score = model.predict_proba(allpts)[:,1 ].reshape(xgrid0.shape) score = log(score / (1 -score)) maxscore = ceil(abs (score).max ()) mylevels = linspace(-maxscore, maxscore, 11 ) plt.imshow(score, origin='lower' , extent=axbox, alpha=0.30 , cmap=mycmap, vmin=-maxscore, vmax=maxscore, aspect='auto' ) plt.contour(xr[0 ], xr[1 ], score, levels=[0 ], linestyles='solid' , colors='k' , linewidths=2 ) plt.axis(axbox); plt.grid(True )
1
2
3
4
5
6
7
8
9
10
11
12
13
14
15
16
17
18
19
20
21
22
23
24
25
26
27
28
29
30
31
32
33
34
35
36
37
38
39
40
41
42
43
44
45
46
47
plts = {} ns = [1 , 2 , 3 , 4 , 5 ] N = X3.shape[0 ] XW = ones(N) / N from sklearn import ensemblefor n in ns: clf = ensemble.AdaBoostClassifier(n_estimators=n, random_state=4487 , algorithm='SAMME' ) clf.fit(X3, Y3) plts[n] = plt.figure(figsize=(9 ,3 )) wl = clf.estimators_[n-1 ] wlf = wl.tree_.feature[0 ] wlt = wl.tree_.threshold[0 ] if wl.tree_.value[2 ,0 ,1 ] > wl.tree_.value[2 ,0 ,0 ]: wld = 'gt' else : wld = 'lt' plt.subplot(1 ,2 ,1 ) drawstump(wlf, wlt, fdir=wld, poscol='g' , negcol='r' ) mys = 20 *sqrt(XW*N) plt.scatter(X3[:,0 ], X3[:,1 ], c=Y3, s=mys, cmap=mycmap, edgecolors='k' ) plt.xlabel('$x_1$' ); plt.ylabel('$x_2$' ) plt.axis(axbox3); plt.grid(True ) plt.title('iter ' +str (n) + " weak learner" ) plt.subplot(1 ,2 ,2 ) plot_boosting(clf, axbox3, X3) plt.scatter(X3[:,0 ], X3[:,1 ], c=Y3, cmap=mycmap, edgecolors='k' ) plt.xlabel('$x_1$' ); plt.ylabel('$x_2$' ) plt.title('iter ' +str (n) + " classifier" ) tmpY = clf.estimators_[n-1 ].predict(X3) err = sum ((tmpY != Y3)*XW) alpha = 0.5 *log((1 -err) / err) scale = 2 *(tmpY!=Y3)-1 XW = XW * exp(scale*alpha) XW = XW / sum (XW) plt.close()
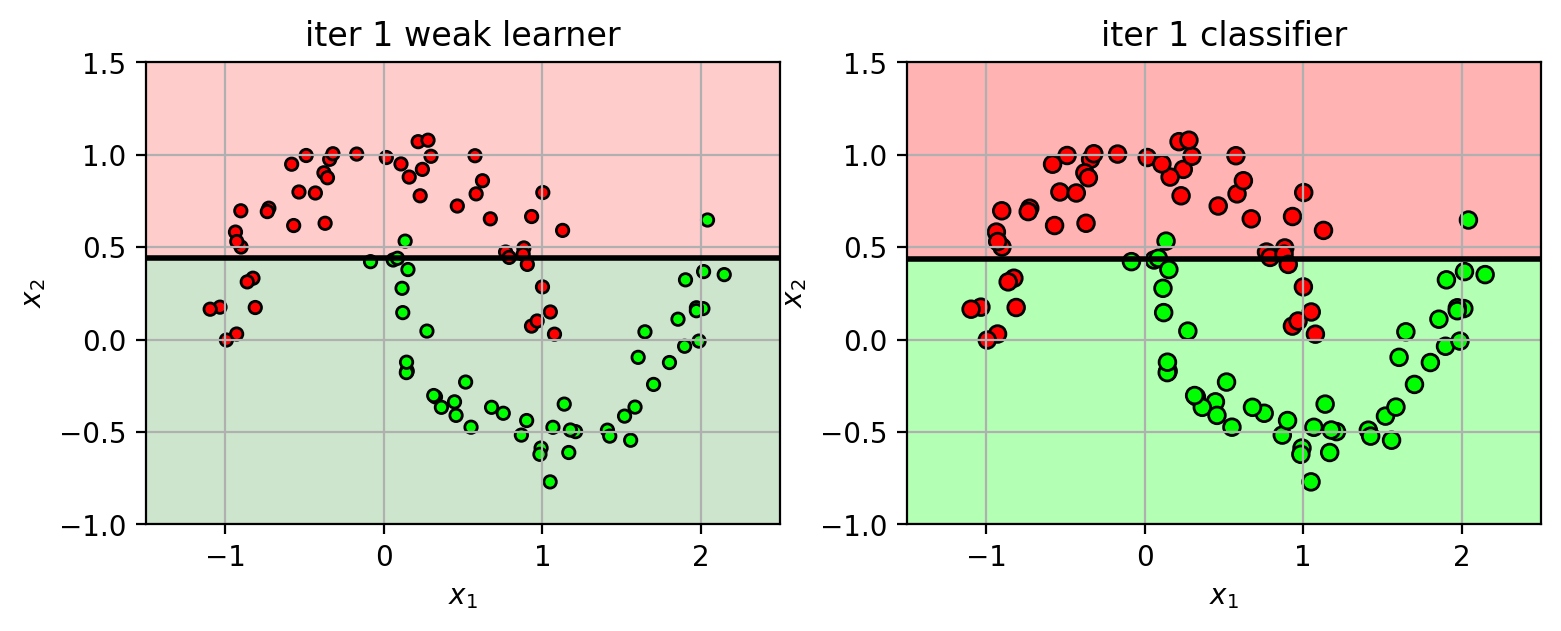
Iteration 1
Initially, weights for all training samples are equal: $w_i = 1/N$
Pick best weak learner $h_1(\mathbf{x})$.
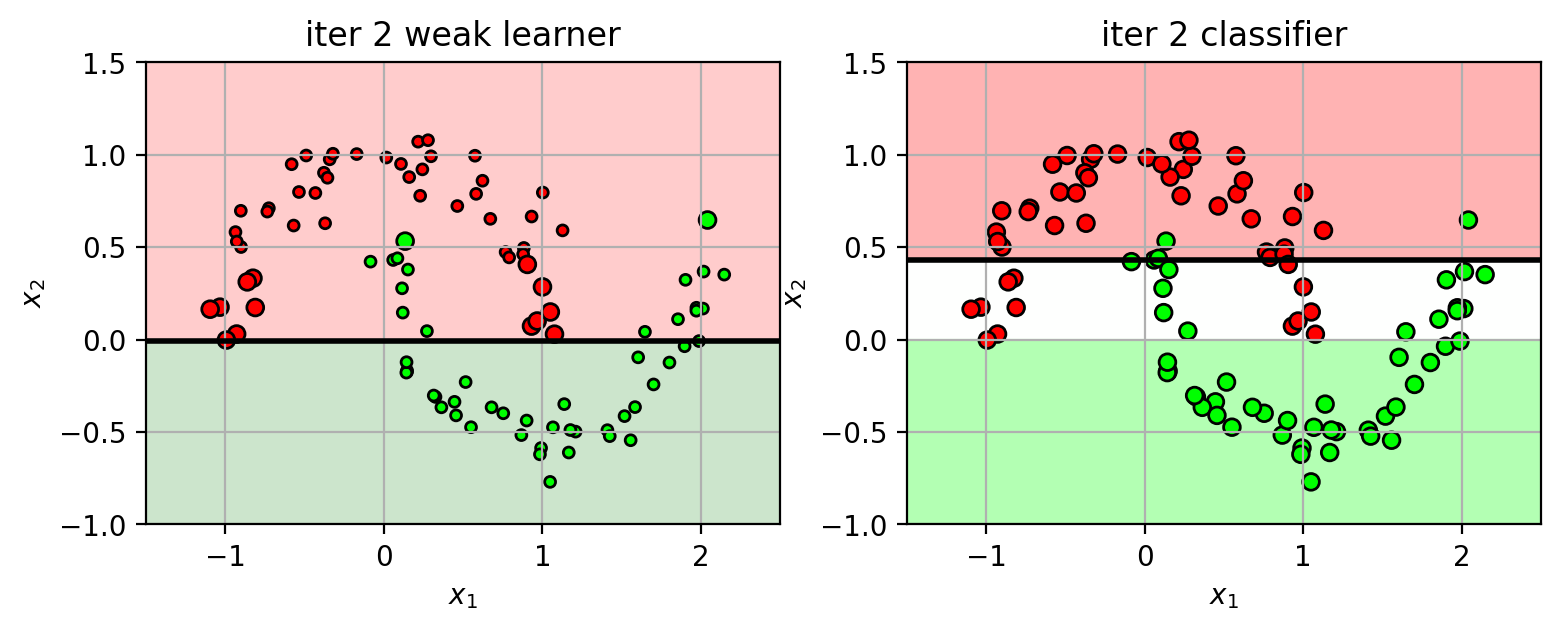
Iteration 2 (part 1)
points are re-weighted based on the previous errors:
increase weights for misclassified samples: $w_i = w_i e^{\alpha}$
decrease weights for correctly classified samples: $w_i = w_i e^{-\alpha}$
$\alpha = 0.5 \log \frac{1-err}{err}$ is based on the weighted error of the previous weak learner.
(larger circles indicates higher weight)
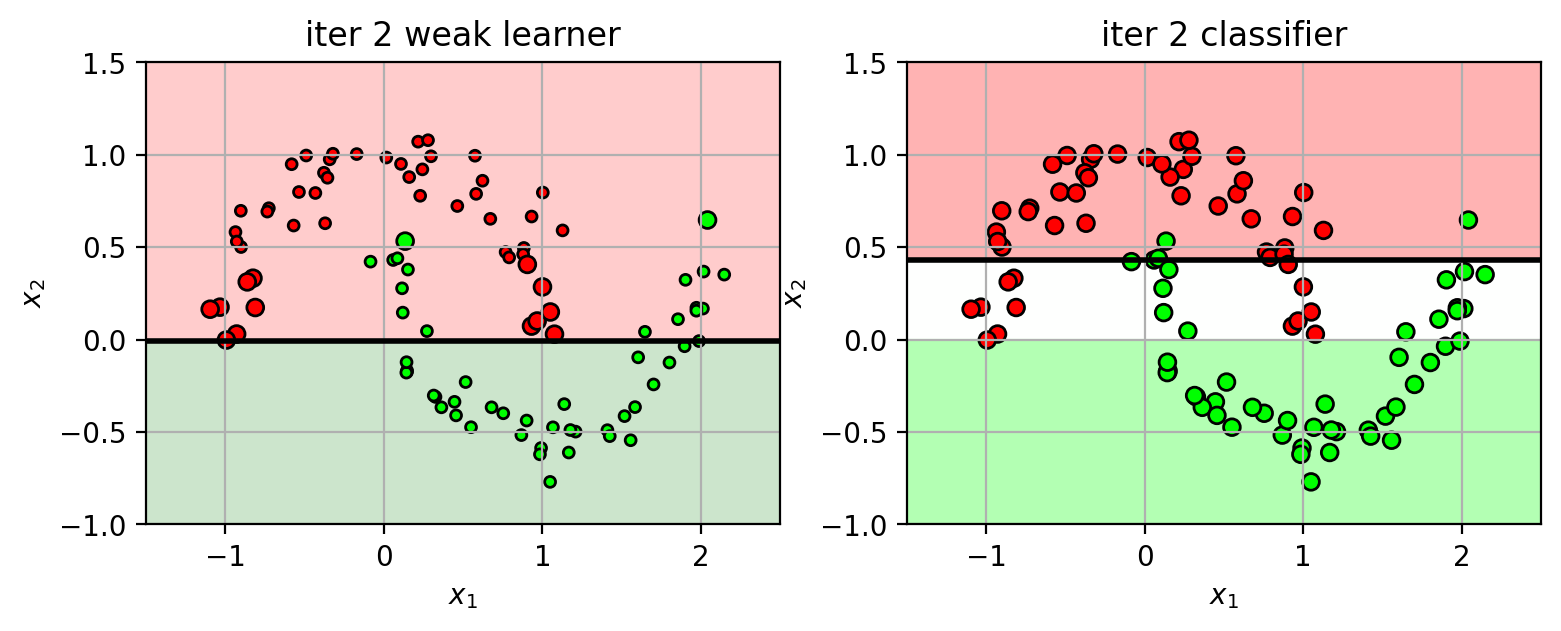
Iteration 2 (part 2)
using the weighted data, train another weak learner $h_2(\mathbf{x})$.
the classifier function is the weighted sum of weak learners
$f_2(\mathbf{x}) = f_1(\mathbf{x}) + \alpha_2 h_2(\mathbf{x})$
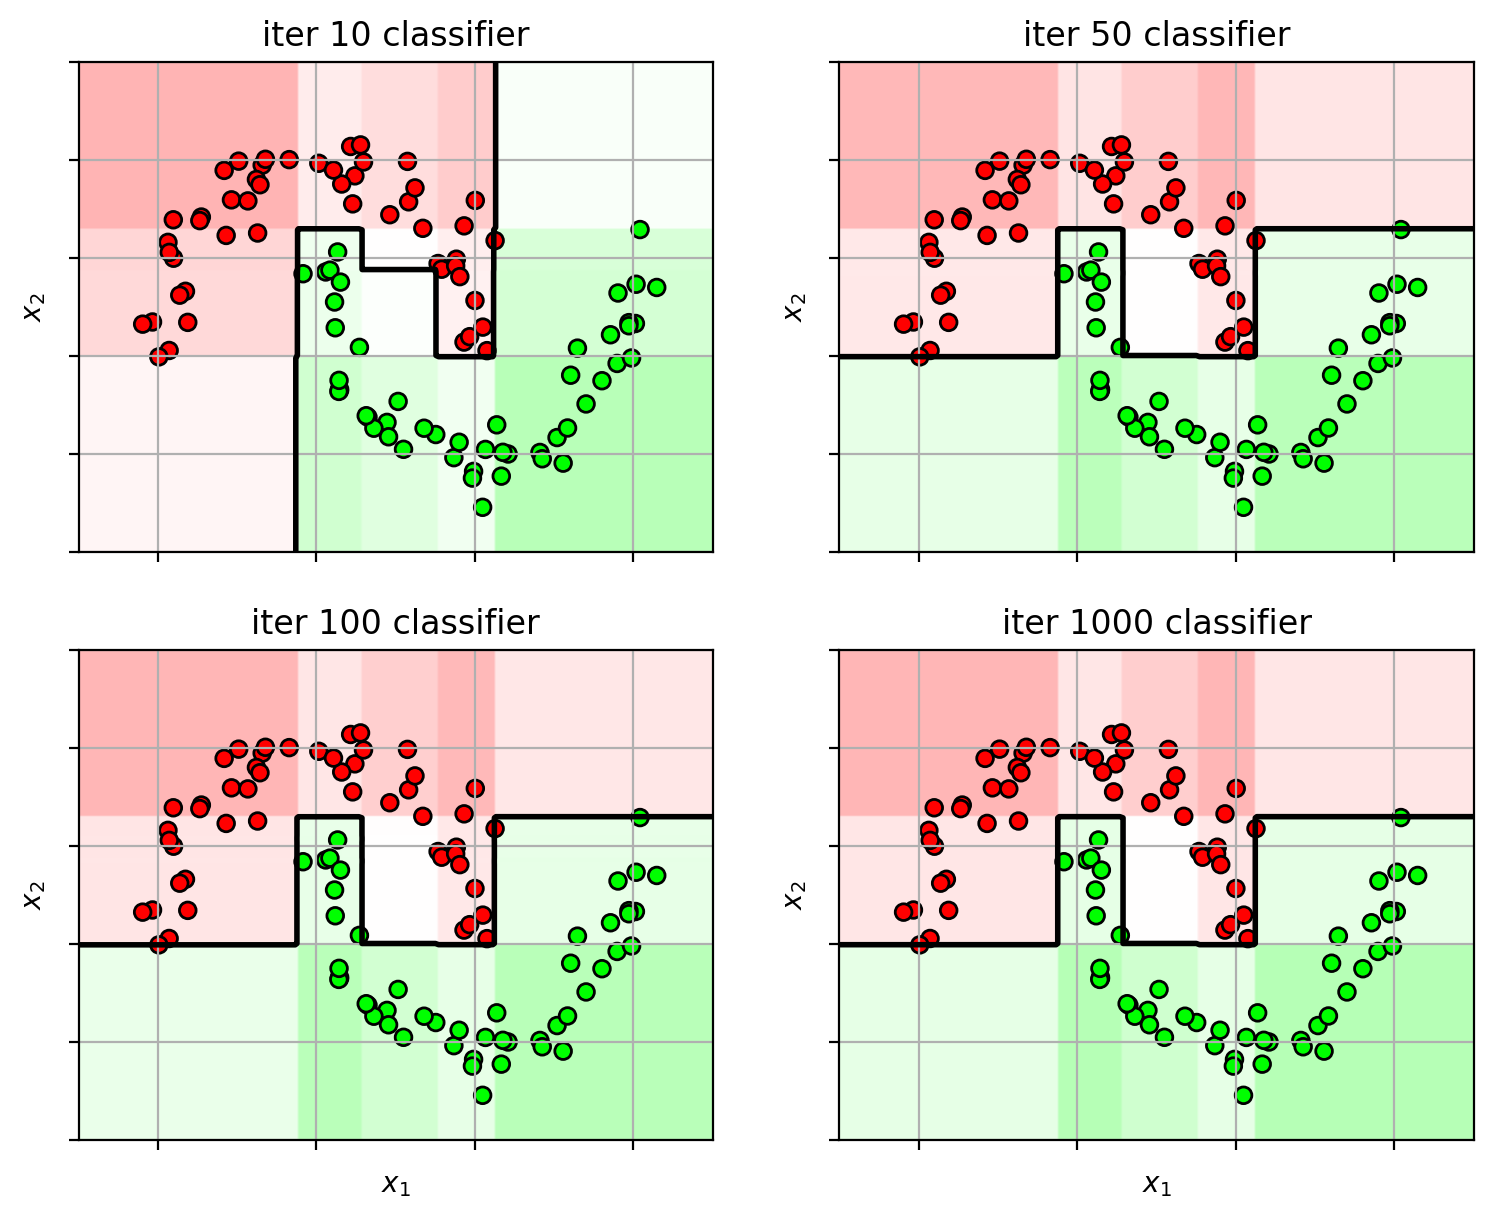
Keep iterating…
1
2
3
4
5
6
7
8
9
10
11
12
13
14
15
16
17
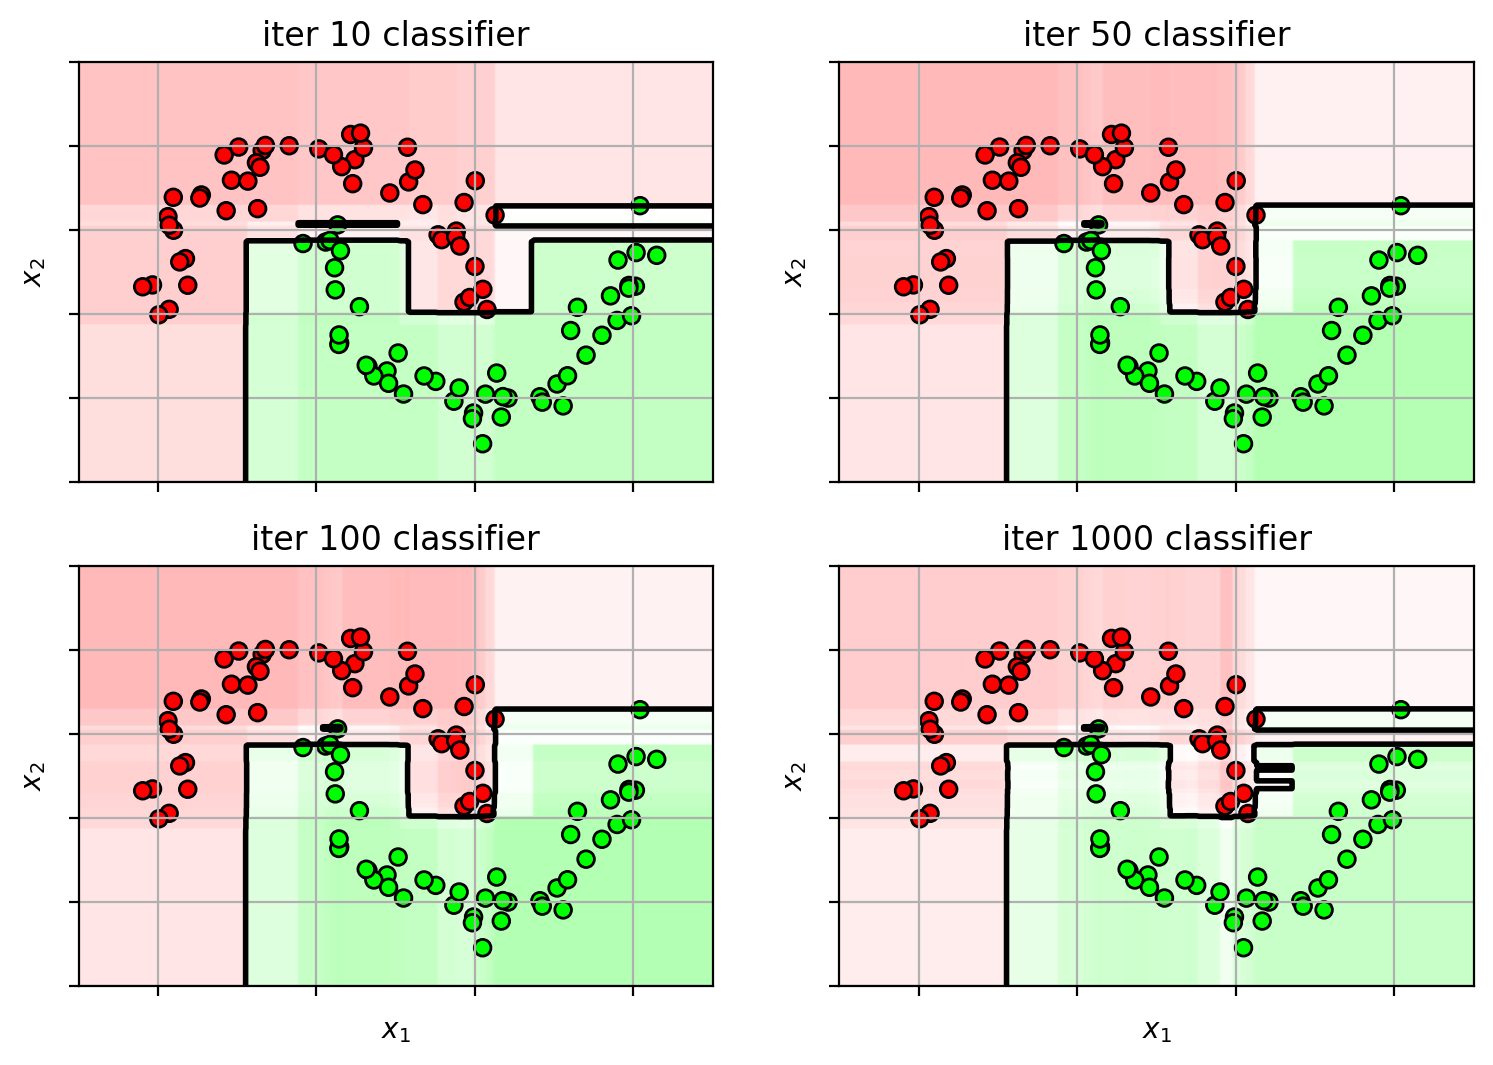
ns = [10 , 50 , 100 , 1000 ] adafig = plt.figure(figsize=(9 ,7 )) for i,n in enumerate (ns): clf = ensemble.AdaBoostClassifier(n_estimators=n, random_state=4487 ) clf.fit(X3, Y3) plt.subplot(2 ,2 ,i+1 ) plot_boosting(clf, axbox3, X3) plt.scatter(X3[:,0 ], X3[:,1 ], c=Y3, cmap=mycmap, edgecolors='k' ) if i>=2 : plt.xlabel('$x_1$' ) plt.ylabel('$x_2$' ) plt.gca().xaxis.set_ticklabels([]) plt.gca().yaxis.set_ticklabels([]) plt.title('iter ' +str (n) + " classifier" ) plt.close()
Adaboost Algorithm
Given data ${(\mathbf{x}_i, y_i)}$.
Initialize data weights, $w_i=1/N, \forall i$.
For $t$ = 1 to T,
choose weak learner $h_t(\mathbf{x})$
minimize the weighted classification error: $\epsilon_t = \sum_{i=1}^N w_i \mathbb{1}(h_t(\mathbf{x}_i) \neq y_i)$.
Set the weak learner weight: $\alpha_t = \frac{1}{2}\log(\frac{1-\epsilon_t}{\epsilon_t})$
Add to ensemble: $f_t(\mathbf{x}) = f_{t-1}(\mathbf{x}) + \alpha_t h_t(\mathbf{x})$.
Update data weights:
for all $\mathbf{x}_i$ misclassified, increase weight: $w_i \leftarrow w_i e^{\alpha_t}$.
for all $\mathbf{x}_i$ correctly classified, decrease weight: $w_i \leftarrow w_i e^{-\alpha_t}$.
normalize weights, so that $\sum_i w_i = 1$.
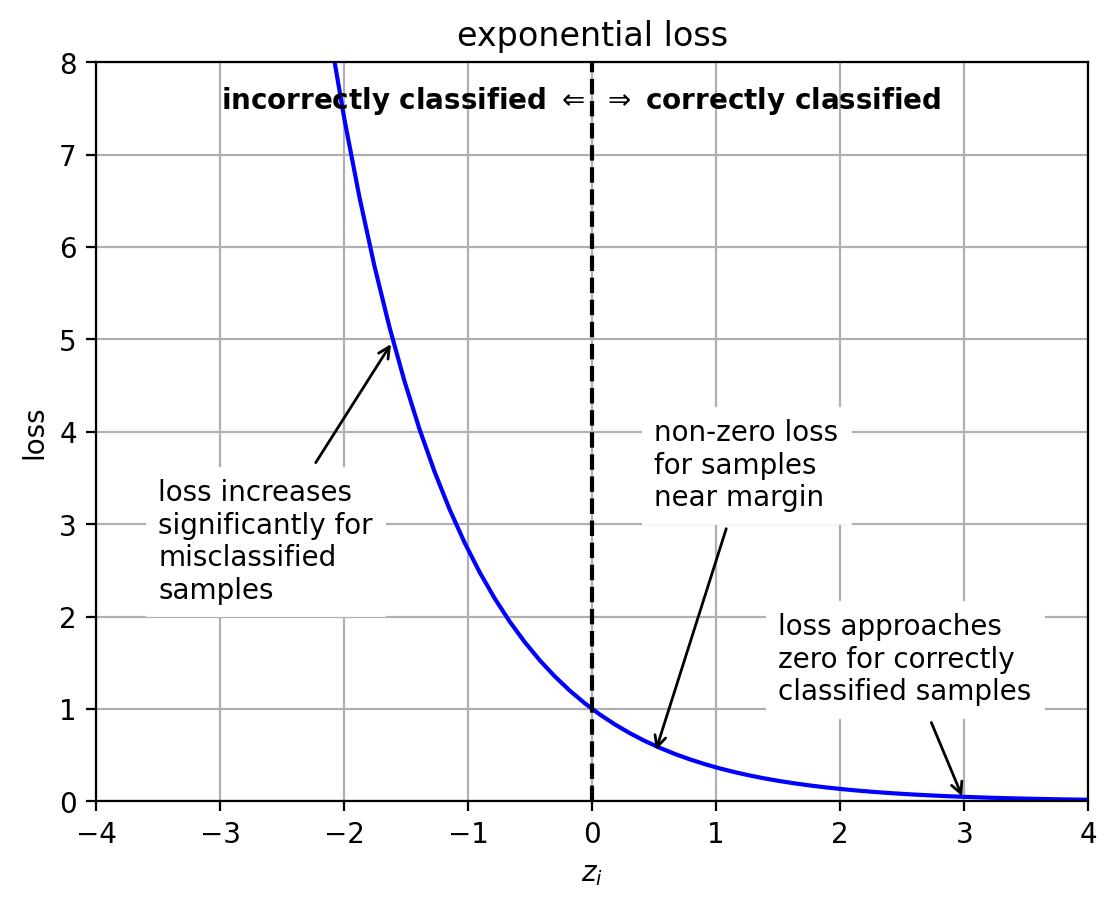
Adaboost loss function
It can be shown that Adaboost is minimizing:
Thus, it is an exponential loss function
$L(z_i) = e^{-z_i}$
$z_i = y_i f(\mathbf{x}_i)$
very sensitive to misclassified outliers.
1
2
3
4
5
6
7
8
9
10
11
12
13
14
15
16
17
18
19
20
21
22
23
24
25
26
z = linspace(-6 ,6 ,100 ) logloss = log(1 +exp(-z)) hingeloss = maximum(0 , 1 -z) exploss = exp(-z) lossfig = plt.figure() plt.plot(z,exploss, 'b-' ) plt.plot([0 ,0 ], [0 ,9 ], 'k--' ) plt.text(0 ,7.5 , "incorrectly classified $\\Leftarrow$ " , ha='right' , weight='bold' ) plt.text(0 ,7.5 , " $\Rightarrow$ correctly classified" , ha='left' , weight='bold' ) plt.annotate(text="loss increases\nsignificantly for\nmisclassified\nsamples" , xy=(-1.6 ,5 ), xytext=(-3.5 ,2.2 ),backgroundcolor='white' , arrowprops=dict (arrowstyle="->" )) plt.annotate(text="non-zero loss\nfor samples\nnear margin" , xy=(0.5 ,0.5 ), xytext=(0.5 ,3.2 ), backgroundcolor='white' , arrowprops=dict (arrowstyle="->" )) plt.annotate(text="loss approaches\nzero for correctly\nclassified samples" , xy=(3 ,0.0 ), xytext=(1.5 ,1.1 ), backgroundcolor='white' , arrowprops=dict (arrowstyle="->" )) plt.axis([-4 , 4 , 0 , 8 ]) plt.grid(True ) plt.xlabel('$z_i$' ); plt.ylabel('loss' ) plt.title('exponential loss' ) plt.close()
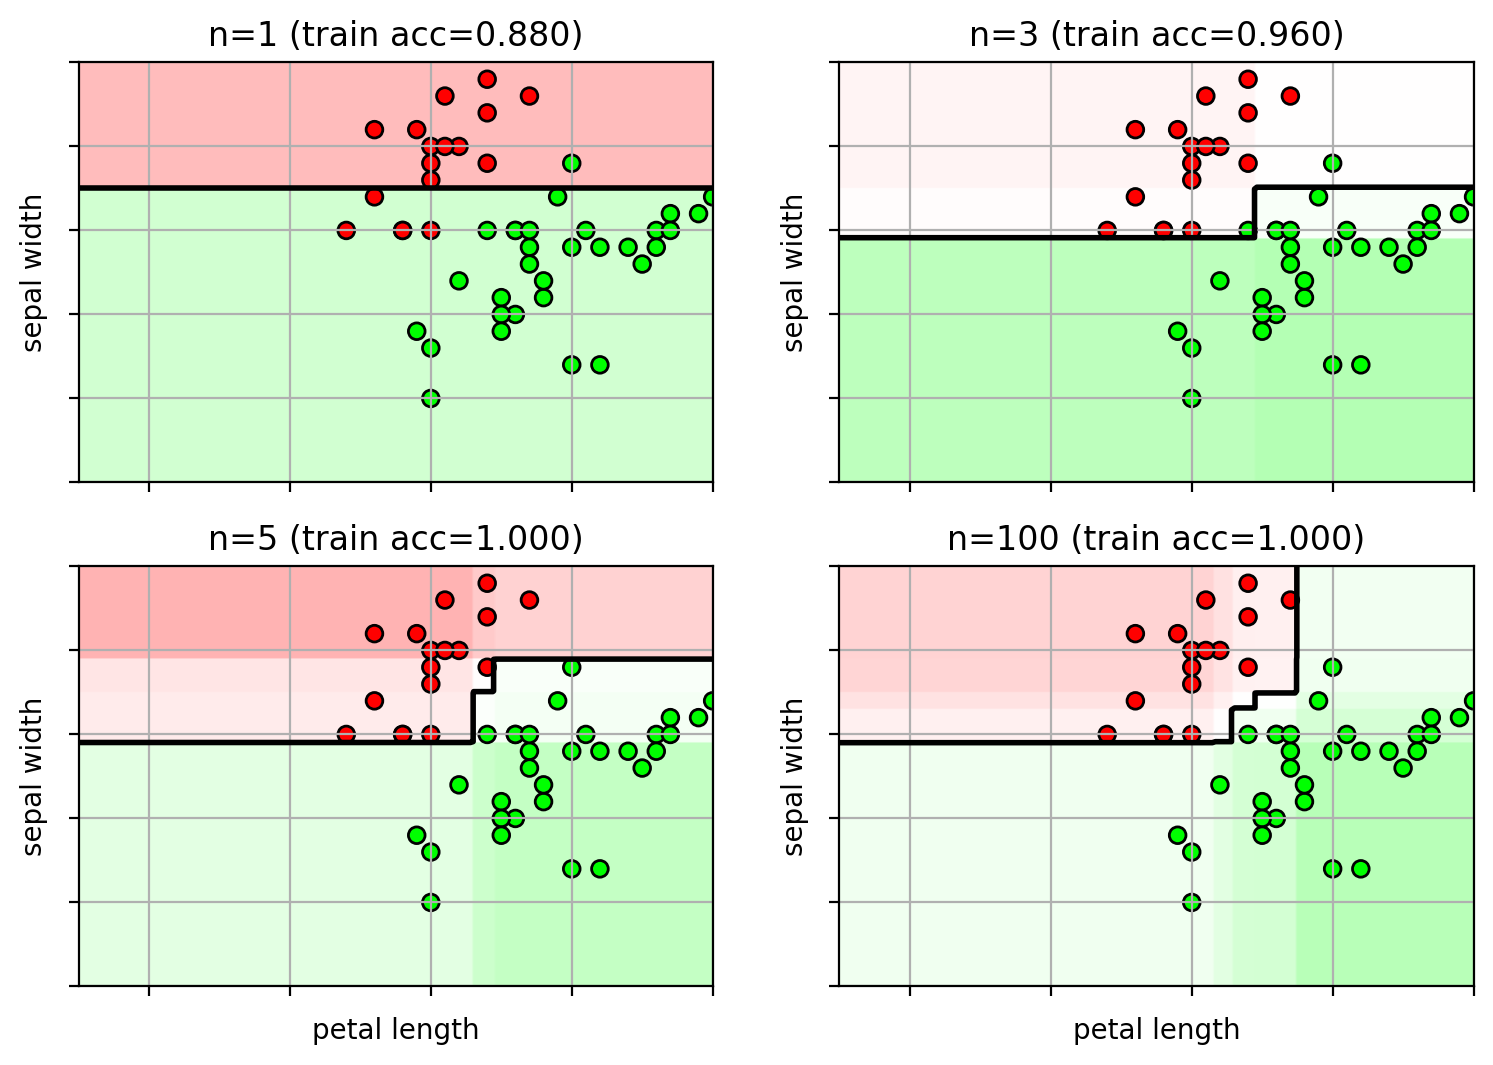
Example on Iris data
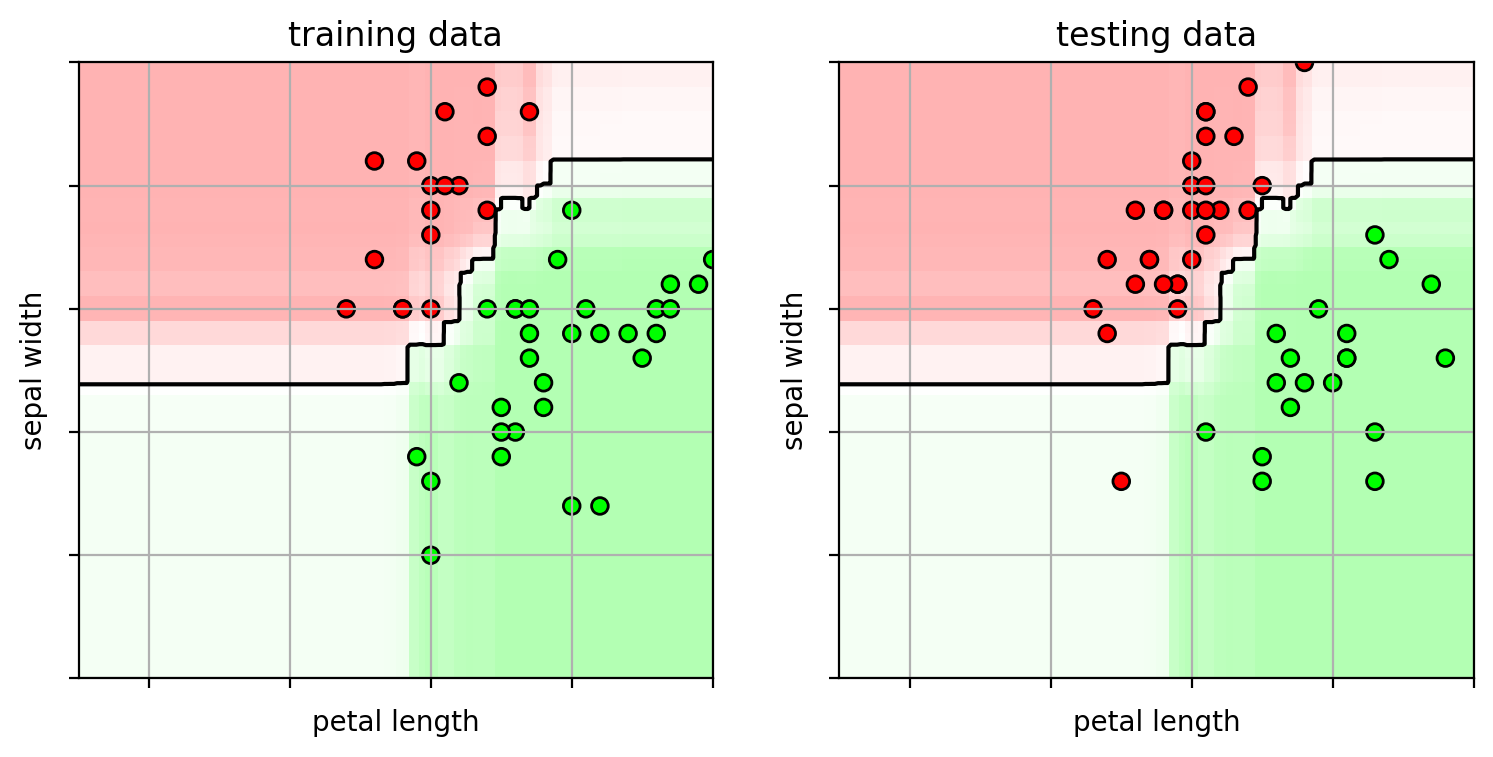
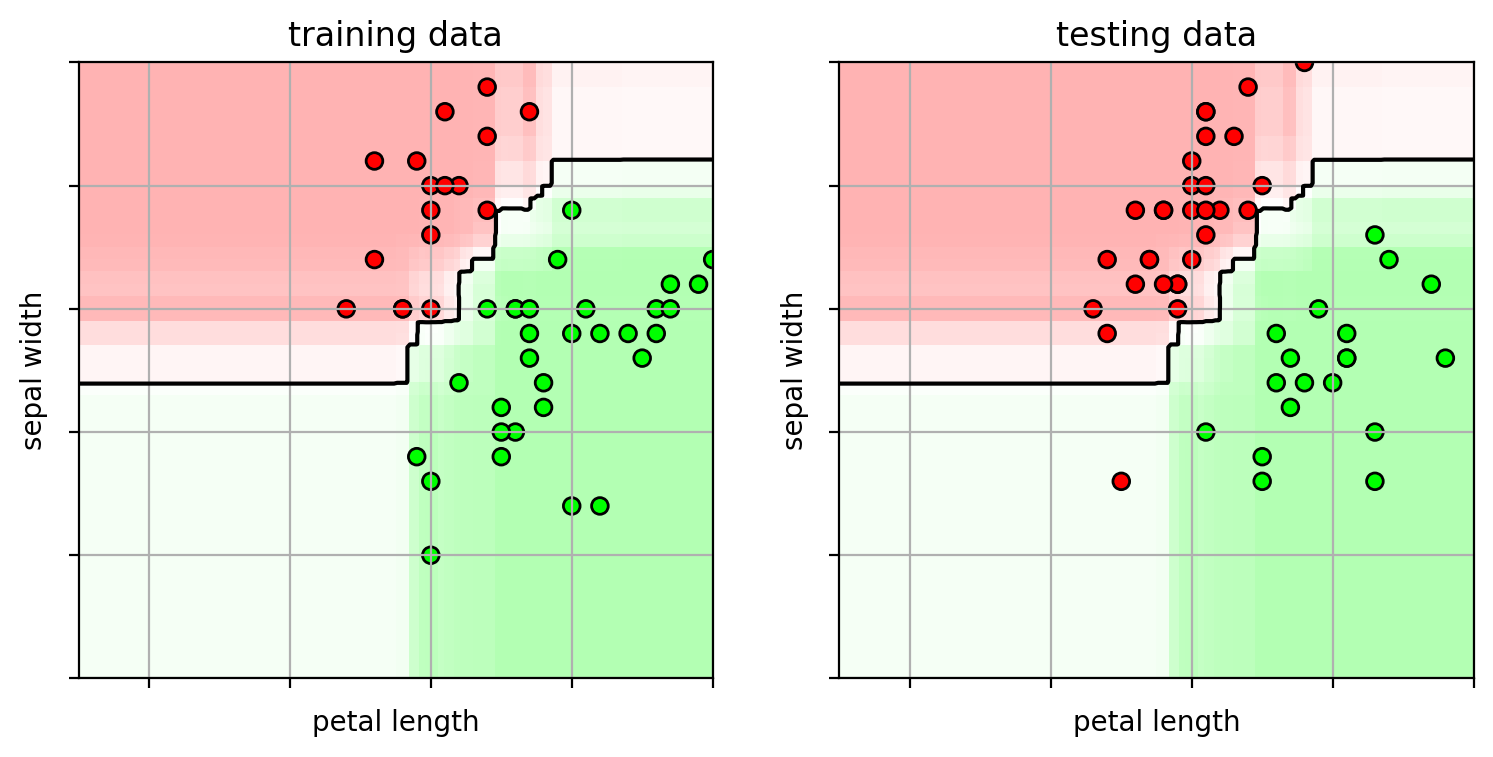
Too many weak-learners and AdaBoost carves out space for the outliers.
1 2 3 4 5 6 7 8 9 from sklearn.datasets import load_irisirisdata = load_iris() X = irisdata.data[:100 ,0 :2 ] Y = irisdata.target[:100 ] print (X.shape)
(100, 2)
1 2 3 4 5 6 7 8 from sklearn import model_selectiontrainX, testX, trainY, testY = \ model_selection.train_test_split(X, Y, train_size=0.5 , test_size=0.5 , random_state=4487 ) print (trainX.shape)print (testX.shape)
(50, 2)
(50, 2)
1
2
3
4
5
6
7
8
9
10
11
12
13
14
15
16
17
18
19
20
21
22
23
24
from sklearn import metricsns = [1 , 3 , 5 , 100 ] clf = {} for i,n in enumerate (ns): clf[n] = ensemble.AdaBoostClassifier(n_estimators=n, random_state=4487 ) clf[n].fit(trainX, trainY) axbox = [2.5 , 7 , 1.5 , 4 ] irisfig = plt.figure(figsize=(9 ,6 )) for i,n in enumerate (ns): clfx = clf[n] plt.subplot(2 ,2 ,i+1 ) plot_boosting(clfx, axbox, trainX) plt.scatter(trainX[:,0 ], trainX[:,1 ], c=trainY, cmap=mycmap, edgecolors='k' ) if i>=2 : plt.xlabel('petal length' ) plt.ylabel('sepal width' ) plt.gca().xaxis.set_ticklabels([]) plt.gca().yaxis.set_ticklabels([]) trainerr = metrics.accuracy_score(trainY, clfx.predict(trainX)) plt.title("n=" + str (n) + " (train acc={:.3f})" .format (trainerr)) plt.close()
Note: sklearn uses Real AdaBoost by default
uses class probabilities instead of binary class predictions (usually converges faster and has lower error)
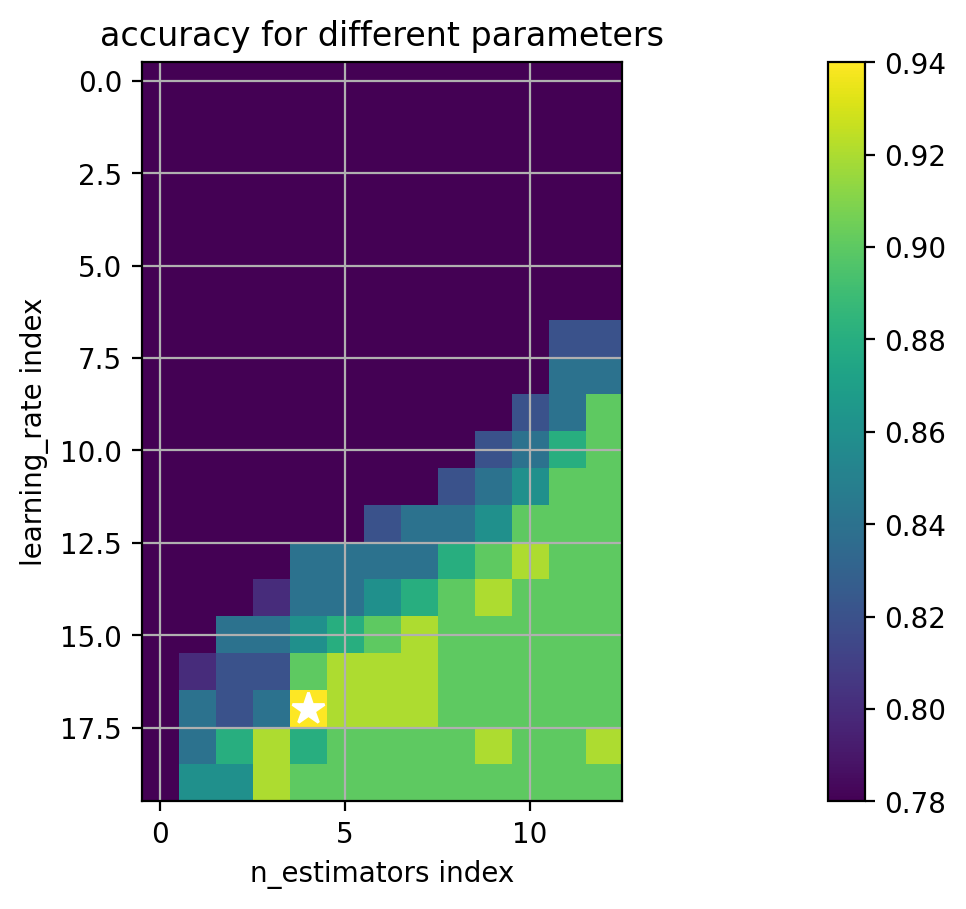
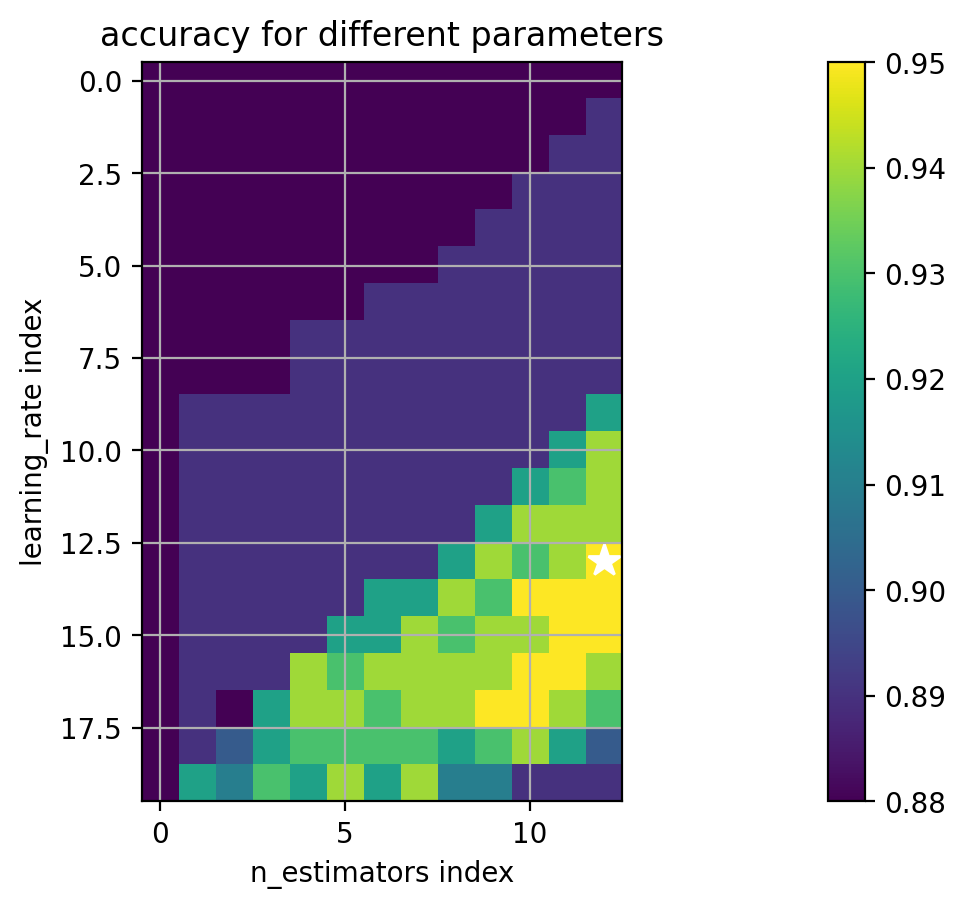
Two hyperparameters regularize boosting:
the number of weak learners - how many boosting iterations
the “learning rate” - a factor for scaling the contribution of each weak-learner
usually between 0 and 1.
Also called “shrinkage”.
Smaller learning rates require more weak learners.
Estimate with cross-validation.
1
2
3
4
5
6
7
8
9
10
11
12
13
14
15
16
17
18
19
def extract_grid_scores (modelcv, paramgrid ): "extract CV scores from GridSearchCV and put into a matrix" pkeys = list (paramgrid.keys()) scoresize = [len (paramgrid[p]) for p in pkeys] avgscores = zeros(scoresize) for rm,rp in zip (modelcv.cv_results_['mean_test_score' ], modelcv.cv_results_['params' ]): myind = [where(rp[p] == paramgrid[p]) for p in pkeys] avgscores[tuple (myind)] = rm bestind = [where(modelcv.best_params_[p] == paramgrid[p]) for p in pkeys] return avgscores, pkeys, bestind
1 2 3 4 5 6 7 8 9 10 11 12 13 14 15 paramgrid = {'learning_rate' : logspace(-6 ,0 ,20 ), 'n_estimators' : array([1 , 2 , 3 , 5 , 10 , 15 , 20 , 25 , 50 , 100 , 200 , 500 , 1000 ]) } print (paramgrid)adacv = model_selection.GridSearchCV(ensemble.AdaBoostClassifier(random_state=4487 ), paramgrid, cv=5 , n_jobs=-1 ) adacv.fit(trainX, trainY); print ("best params:" , adacv.best_params_)
{'learning_rate': array([1.00000000e-06, 2.06913808e-06, 4.28133240e-06, 8.85866790e-06,
       1.83298071e-05, 3.79269019e-05, 7.84759970e-05, 1.62377674e-04,
       3.35981829e-04, 6.95192796e-04, 1.43844989e-03, 2.97635144e-03,
       6.15848211e-03, 1.27427499e-02, 2.63665090e-02, 5.45559478e-02,
       1.12883789e-01, 2.33572147e-01, 4.83293024e-01, 1.00000000e+00]), 'n_estimators': array([   1,    2,    3,    5,   10,   15,   20,   25,   50,  100,  200,
        500, 1000])}
best params: {'learning_rate': 0.23357214690901212, 'n_estimators': 10}
1
2
3
4
5
6
7
8
9
(avgscores, pnames, bestind) = extract_grid_scores(adacv, paramgrid) paramfig = plt.figure() plt.imshow(avgscores, interpolation='nearest' ) plt.plot(bestind[1 ], bestind[0 ], '*w' , markersize=12 ) plt.ylabel(pnames[0 ] + ' index' ); plt.xlabel(pnames[1 ] + ' index' ) plt.grid(True ) plt.title('accuracy for different parameters' ) plt.colorbar() plt.axis('image' );
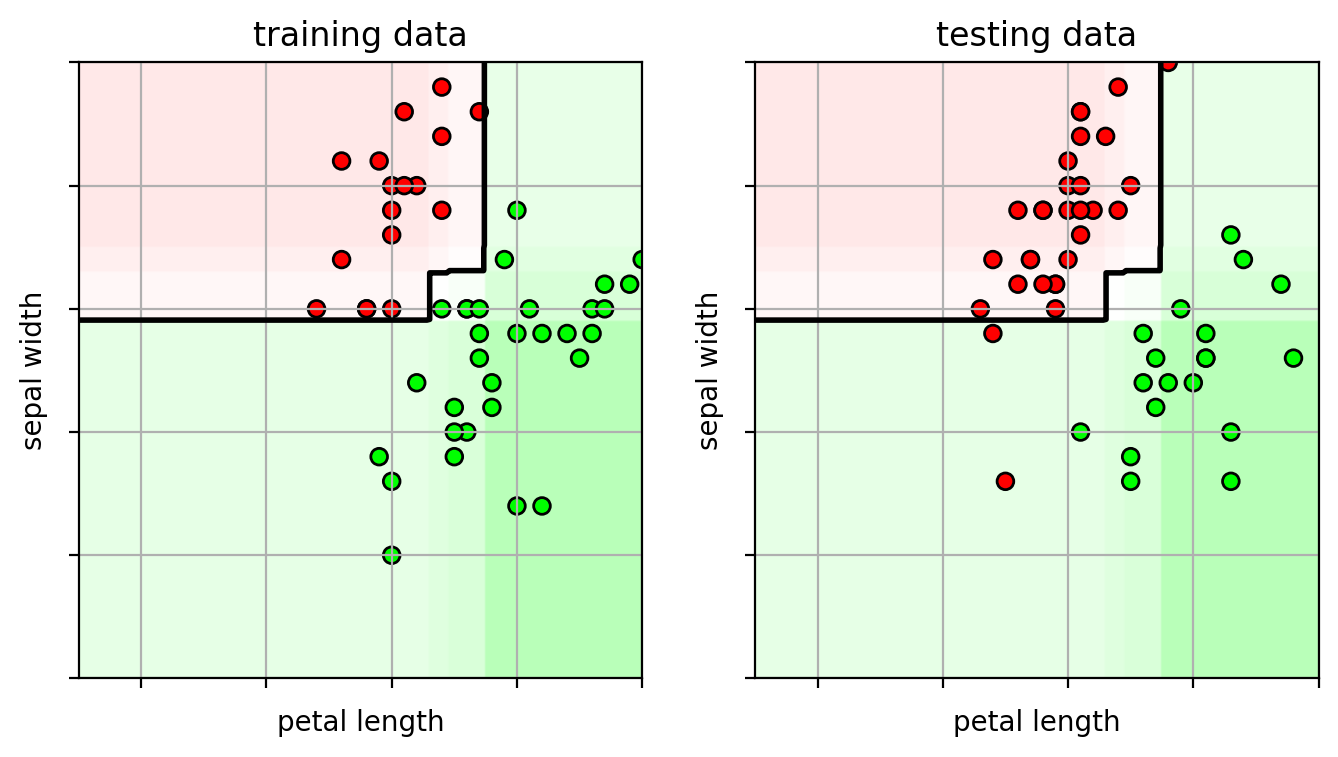
1 2 3 4 5 6 predY = adacv.predict(testX) acc = metrics.accuracy_score(testY, predY) print ("test accuracy =" , acc)
test accuracy = 0.94
1
2
3
4
5
6
7
8
9
10
11
12
13
14
15
16
17
ifig2 = plt.figure(figsize=(8 ,4 )) plt.subplot(1 ,2 ,1 ) plot_boosting(adacv.best_estimator_, axbox, trainX) plt.scatter(trainX[:,0 ], trainX[:,1 ], c=trainY, cmap=mycmap, edgecolors='k' ) plt.xlabel('petal length' ); plt.ylabel('sepal width' ) plt.gca().xaxis.set_ticklabels([]) plt.gca().yaxis.set_ticklabels([]) plt.title("training data" ) plt.subplot(1 ,2 ,2 ) plot_boosting(adacv.best_estimator_, axbox, trainX) plt.scatter(testX[:,0 ], testX[:,1 ], c=testY, cmap=mycmap, edgecolors='k' ) plt.xlabel('petal length' ); plt.ylabel('sepal width' ) plt.gca().xaxis.set_ticklabels([]) plt.gca().yaxis.set_ticklabels([]) plt.title("testing data" ) plt.close()
Boosting can do feature selection
each decision stump classifier looks at one feature
One of the original face detection methods (Viola-Jones) used Boosting.
extract a lot of image features from the face
during training, Boosting learns which ones are the most useful.
Gradient Boosting
Variant of boosting
each iteration fits the residual between the current predictions and the true labels.
the residual is computed as the gradient of the loss function.
It’s a gradient descent algorithm
in each iteration, the weak learner fits the gradient of the loss
$h_t(\mathbf{x}) \approx \frac{dL}{d\mathbf{f}}$
and adds it to the function:
$f_t(\mathbf{x}) = f_{t-1}(\mathbf{x}) - \alpha_t h_t(\mathbf{x}) \approx f_{t-1}(\mathbf{x}) - \alpha_t \frac{dL}{d\mathbf{f}_{t-1}}$
Generalizes boosting to other loss functions.
Typically uses decision trees for the weak learner:
At each node, move down the tree based on that node’s criteria.
leaf node contains the prediction
1
2
3
4
5
6
7
8
9
10
11
12
13
14
15
16
17
18
19
import xgboost as xgbns = [10 , 50 , 100 , 1000 ] xgbfig = plt.figure(figsize=(9 ,6 )) for i,n in enumerate (ns): clf = xgb.XGBClassifier(objective="binary:logistic" , eval_metric='logloss' , random_state=42 , n_estimators=n, use_label_encoder=False ) clf.fit(X3, Y3) plt.subplot(2 ,2 ,i+1 ) plot_boosting(clf, axbox3, X3) plt.scatter(X3[:,0 ], X3[:,1 ], c=Y3, cmap=mycmap, edgecolors='k' ) if i>=2 : plt.xlabel('$x_1$' ) plt.ylabel('$x_2$' ) plt.gca().xaxis.set_ticklabels([]) plt.gca().yaxis.set_ticklabels([]) plt.title('iter ' +str (n) + " classifier" ) plt.close()
/Library/Frameworks/Python.framework/Versions/3.9/lib/python3.9/site-packages/xgboost/sklearn.py:1395: UserWarning: `use_label_encoder` is deprecated in 1.7.0.
  warnings.warn("`use_label_encoder` is deprecated in 1.7.0.")
Example
more iterations tends to overfit severely
because the “weak” classifier is actually strong (decision tree).
Cross-validation
select the best hyperparameters
number of estimators
learning rate (shrinkage term)
1 2 3 4 5 6 7 8 9 10 11 12 13 14 15 16 17 18 19 20 import xgboost as xgbxclf = xgb.XGBClassifier(objective="binary:logistic" , eval_metric='logloss' , random_state=4487 , use_label_encoder=False ) paramgrid = {'learning_rate' : logspace(-6 ,0 ,20 ), 'n_estimators' : array([1 , 2 , 3 , 5 , 10 , 15 , 20 , 25 , 50 , 100 , 200 , 500 , 1000 ]) } print (paramgrid)xgbcv = model_selection.GridSearchCV(xclf, paramgrid, cv=5 , n_jobs=-1 ) xgbcv.fit(X3, Y3); print ("best params:" , xgbcv.best_params_)
{'learning_rate': array([1.00000000e-06, 2.06913808e-06, 4.28133240e-06, 8.85866790e-06,
       1.83298071e-05, 3.79269019e-05, 7.84759970e-05, 1.62377674e-04,
       3.35981829e-04, 6.95192796e-04, 1.43844989e-03, 2.97635144e-03,
       6.15848211e-03, 1.27427499e-02, 2.63665090e-02, 5.45559478e-02,
       1.12883789e-01, 2.33572147e-01, 4.83293024e-01, 1.00000000e+00]), 'n_estimators': array([   1,    2,    3,    5,   10,   15,   20,   25,   50,  100,  200,
        500, 1000])}


/Library/Frameworks/Python.framework/Versions/3.9/lib/python3.9/site-packages/xgboost/sklearn.py:1395: UserWarning: `use_label_encoder` is deprecated in 1.7.0.
  warnings.warn("`use_label_encoder` is deprecated in 1.7.0.")
/Library/Frameworks/Python.framework/Versions/3.9/lib/python3.9/site-packages/xgboost/sklearn.py:1395: UserWarning: `use_label_encoder` is deprecated in 1.7.0.
  warnings.warn("`use_label_encoder` is deprecated in 1.7.0.")


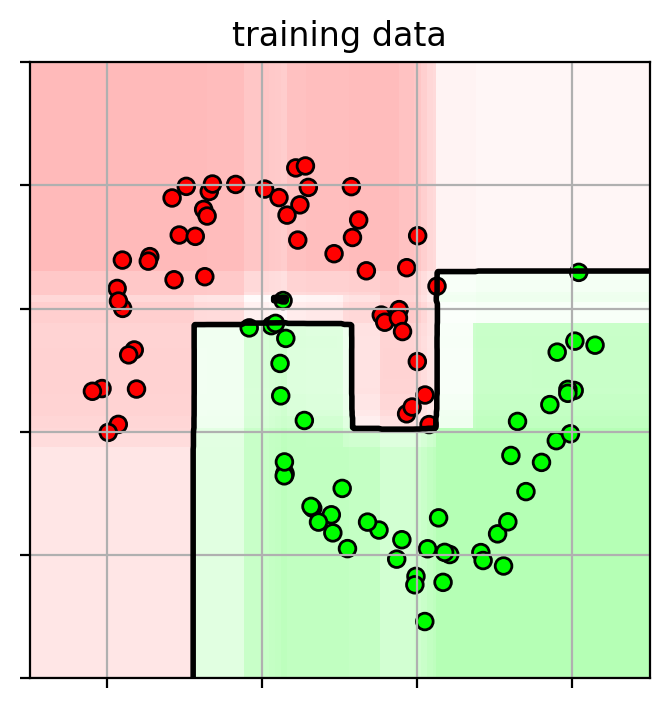
best params: {'learning_rate': 0.012742749857031322, 'n_estimators': 1000}
1
2
3
4
5
6
7
8
9
(avgscores, pnames, bestind) = extract_grid_scores(xgbcv, paramgrid) paramfig = plt.figure() plt.imshow(avgscores, interpolation='nearest' ) plt.plot(bestind[1 ], bestind[0 ], '*w' , markersize=12 ) plt.ylabel(pnames[0 ] + ' index' ); plt.xlabel(pnames[1 ] + ' index' ) plt.grid(True ) plt.title('accuracy for different parameters' ) plt.colorbar() plt.axis('image' );
1
2
3
4
5
6
7
ifig2 = plt.figure(figsize=(4 ,4 )) plot_boosting(xgbcv.best_estimator_, axbox3, X3) plt.scatter(X3[:,0 ], X3[:,1 ], c=Y3, cmap=mycmap, edgecolors='k' ) plt.gca().xaxis.set_ticklabels([]) plt.gca().yaxis.set_ticklabels([]) plt.title("training data" ) plt.close()
Since decision trees are used, there are a lot of hyperparameters to tune for the decision tree.
max_depth: maximum depth of the treegamma: minimum loss reduction in order to split a leaf.colsample_bytree: fraction of features to randomly subsample when building a tree. subsample: fraction of training data to subsample during each boosting iteration (for each tree).
Problem: Too many parameters to use grid-search!
Solution: use randomized search
specify probability distributions for the parameters to try
stats.uniform(a, b) = uniform distribution between [a, a+b]stats.randint(a,b) = random integer between [a, b]
1 2 3 4 5 6 7 8 9 10 11 12 13 14 15 16 17 18 19 20 21 paramsampler = { "colsample_bytree" : stats.uniform(0.7 , 0.3 ), "gamma" : stats.uniform(0 , 0.5 ), "max_depth" : stats.randint(2 , 6 ), "subsample" : stats.uniform(0.6 , 0.4 ), "learning_rate" : stats.uniform(.001 ,1 ), "n_estimators" : stats.randint(10 , 1000 ), } xclf = xgb.XGBClassifier(objective="binary:logistic" , eval_metric='logloss' , random_state=4487 , use_label_encoder=False ) xgbrcv = model_selection.RandomizedSearchCV(xclf, param_distributions=paramsampler, random_state=4487 , n_iter=200 , cv=5 , verbose=1 , n_jobs=-1 ) xgbrcv.fit(X3, Y3) print ("best params:" , xgbrcv.best_params_)
/Library/Frameworks/Python.framework/Versions/3.9/lib/python3.9/site-packages/xgboost/sklearn.py:1395: UserWarning: `use_label_encoder` is deprecated in 1.7.0.
  warnings.warn("`use_label_encoder` is deprecated in 1.7.0.")
/Library/Frameworks/Python.framework/Versions/3.9/lib/python3.9/site-packages/xgboost/sklearn.py:1395: UserWarning: `use_label_encoder` is deprecated in 1.7.0.
  warnings.warn("`use_label_encoder` is deprecated in 1.7.0.")


Fitting 5 folds for each of 200 candidates, totalling 1000 fits
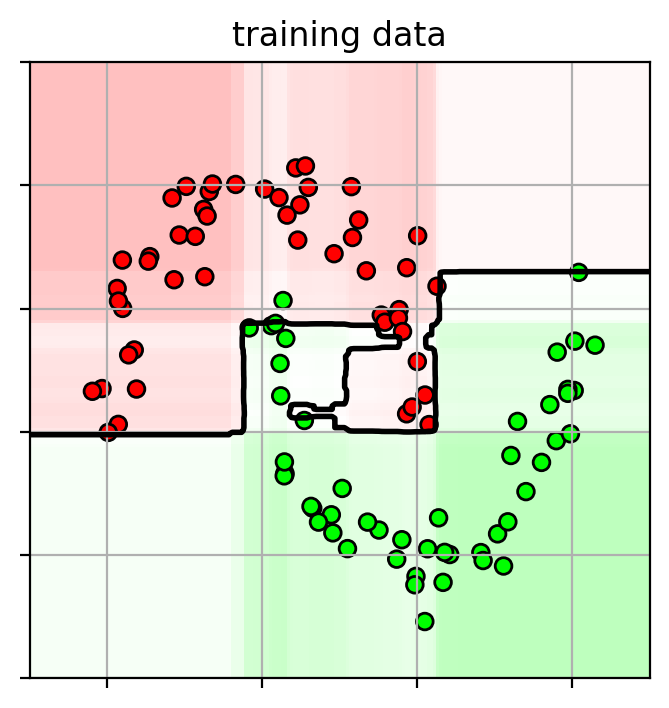
best params: {'colsample_bytree': 0.9682214619643752, 'gamma': 0.43411018169657967, 'learning_rate': 0.014847933781299671, 'max_depth': 4, 'n_estimators': 152, 'subsample': 0.6743715045033899}
1
2
3
4
5
6
7
ifig2 = plt.figure(figsize=(4 ,4 )) plot_boosting(xgbrcv.best_estimator_, axbox3, X3) plt.scatter(X3[:,0 ], X3[:,1 ], c=Y3, cmap=mycmap, edgecolors='k' ) plt.gca().xaxis.set_ticklabels([]) plt.gca().yaxis.set_ticklabels([]) plt.title("training data" ) plt.close()
Boosting Summary
Ensemble Classifier:
Combine the outputs of many “weak” classifiers to make a “strong” classifier
Training:
In each iteration,
training data is re-weighted based on whether it is correctly classified or not.
weak classifier focuses on misclassified data from previous iterations.
Use cross-validation to pick number of weak learners.
Advantages:
Good generalization performance
Built-in features selection - decision stump selects one feature at a time.
Disadvantages:
Outline
Nonlinear classifiers
Kernel trick and kernel SVM
Ensemble Methods - Boosting, Random Forests Classification Summary
Decision Tree
Simple “Rule-based” classifier
At each node, move down the tree based on that node’s criteria.
leaf node contains the prediction
Advantage: can create complex conjunction of rulesDisadvantage: easy to overfit by itself
Random Forest Classifier
Use bagging to make an ensemble of Decision Tree Classifiers
for each Decision Tree Classifier
create a new training set by randomly sampling from the training set
for each split in a tree, select a random subset of features to use
for a test sample, the prediction is aggregated over all trees.
1 2 3 4 clf = ensemble.RandomForestClassifier(n_estimators=4 , random_state=4487 , n_jobs=-1 ) clf.fit(X3, Y3)
RandomForestClassifier(n_estimators=4, n_jobs=-1, random_state=4487) In a Jupyter environment, please rerun this cell to show the HTML representation or trust the notebook. 1 2 3 4 5 6 7 8 9 10 11 12 13 14 15 16 17 18 19 def plot_rf (model, axbox, X ): xr = [ linspace(axbox[0 ], axbox[1 ], 200 ), linspace(axbox[2 ], axbox[3 ], 200 ) ] xgrid0, xgrid1 = meshgrid(xr[0 ], xr[1 ]) allpts = c_[xgrid0.ravel(), xgrid1.ravel()] score = model.predict_proba(allpts)[:,1 ].reshape(xgrid0.shape) plt.imshow(score, origin='lower' , extent=axbox, alpha=0.30 , cmap=mycmap, vmin=0 , vmax=1 , aspect='auto' ) plt.contour(xr[0 ], xr[1 ], score, levels=[0.5 ], linestyles='solid' , colors='k' ) plt.axis(axbox); plt.grid(True )
1 2 3 4 5 6 7 8 9 10 11 12 13 14 15 16 17 axbox = [-1.5 , 2.5 , -1 , 1.5 ] dtfig = plt.figure(figsize=(9 ,7 )) for i,d in enumerate (clf.estimators_): plt.subplot(2 ,2 ,i+1 ) plot_rf(d, axbox, X3) plt.scatter(X3[:,0 ], X3[:,1 ], c=Y3, cmap=mycmap, edgecolors='k' ) plt.gca().xaxis.set_ticklabels([]) plt.gca().yaxis.set_ticklabels([]) plt.title("Decision Tree " + str (i+1 )) plt.close() rffig = plt.figure() plot_rf(clf, axbox, X3) plt.scatter(X3[:,0 ], X3[:,1 ], c=Y3, cmap=mycmap, edgecolors='k' ) plt.colorbar() plt.close()
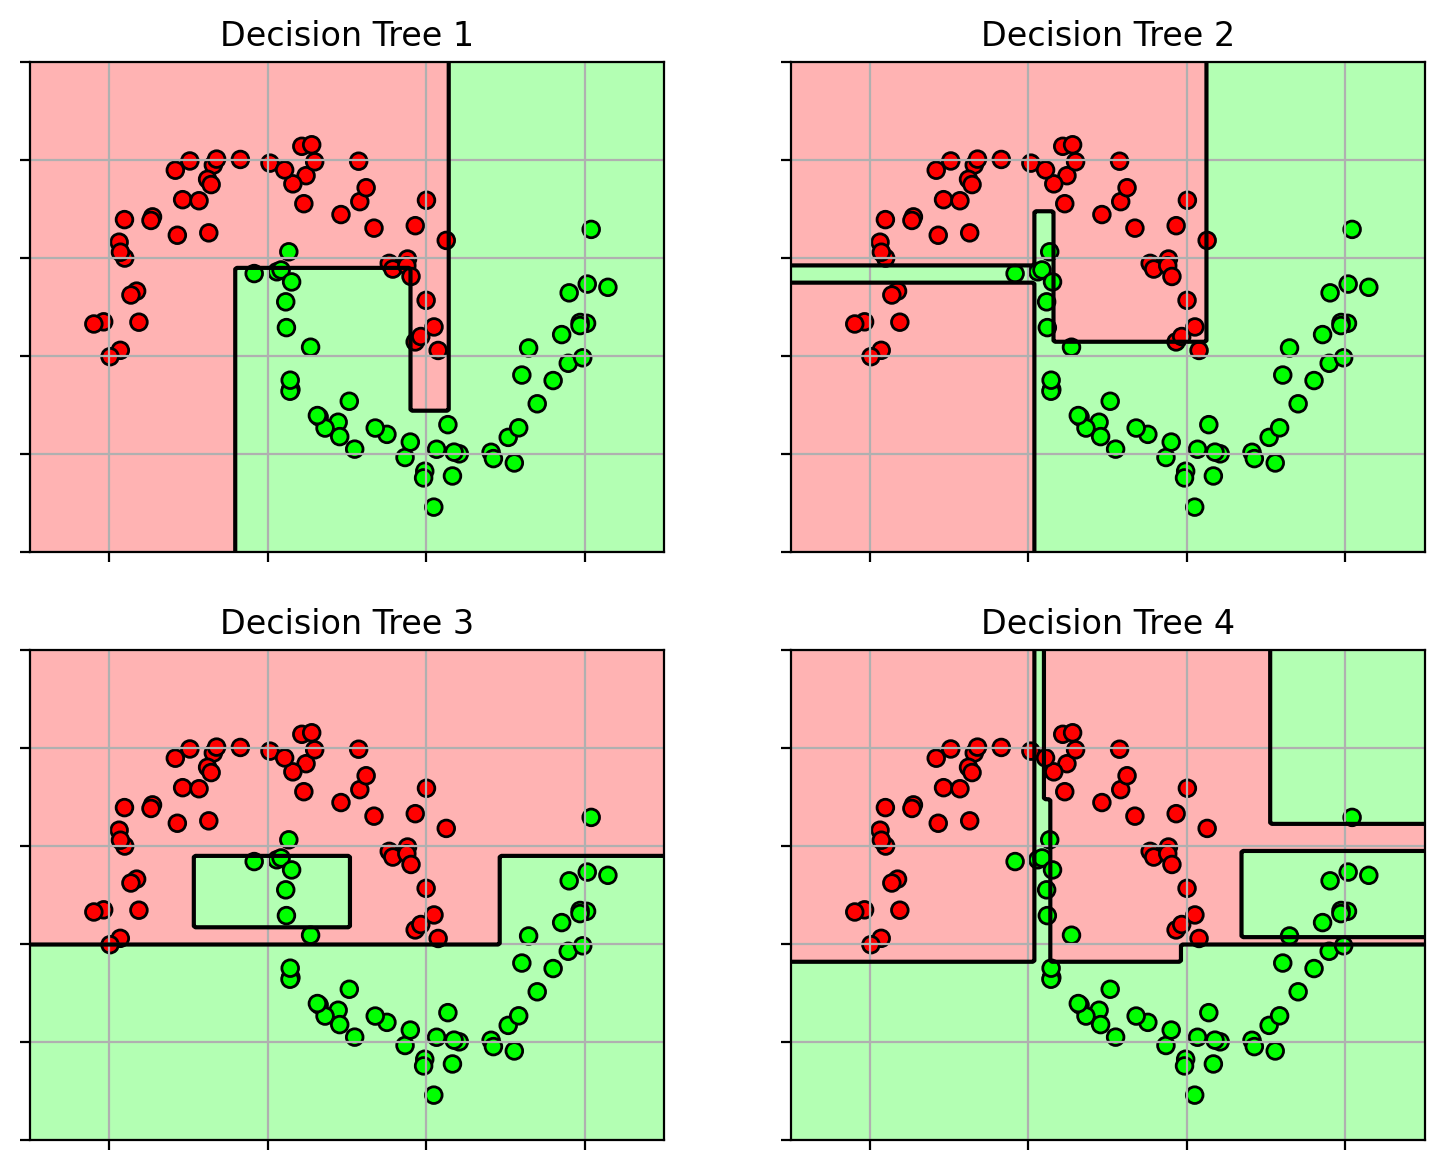
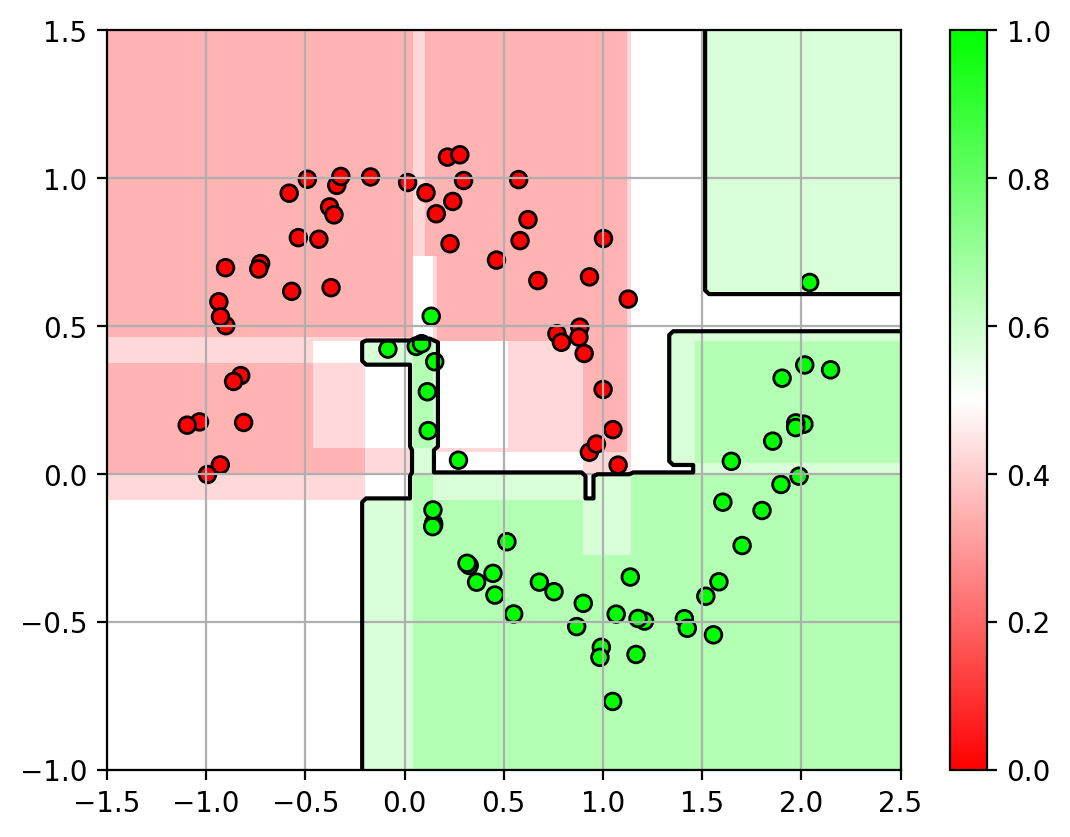
Here are the 4 decision trees
each uses a different random sampling of original training set
and the aggregated classifier
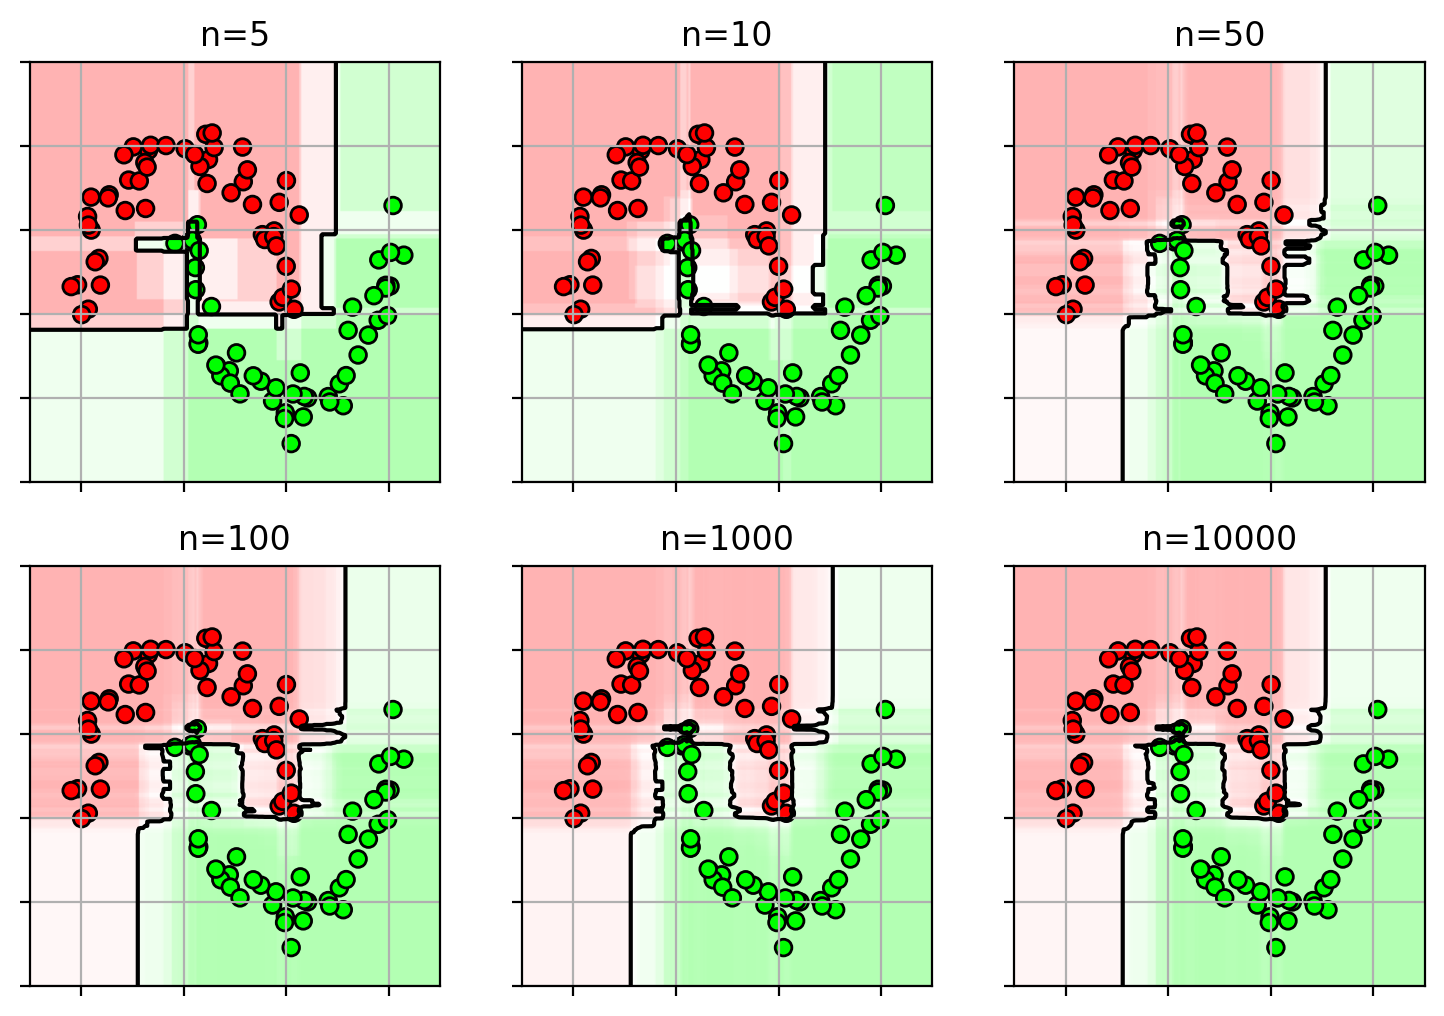
1 2 3 4 5 6 7 8 9 10 11 12 13 14 rffig = plt.figure(figsize=(9 ,6 )) clfs = {} for i,n in enumerate ([5 , 10 , 50 , 100 , 1000 , 10000 ]): clfs[n] = ensemble.RandomForestClassifier(n_estimators=n, random_state=4487 , n_jobs=-1 ) clfs[n].fit(X3, Y3) plt.subplot(2 ,3 ,i+1 ) plot_rf(clfs[n], axbox, X3) plt.scatter(X3[:,0 ], X3[:,1 ], c=Y3, cmap=mycmap, edgecolors='k' ) plt.gca().xaxis.set_ticklabels([]) plt.gca().yaxis.set_ticklabels([]) plt.title("n=" + str (n)) plt.close()
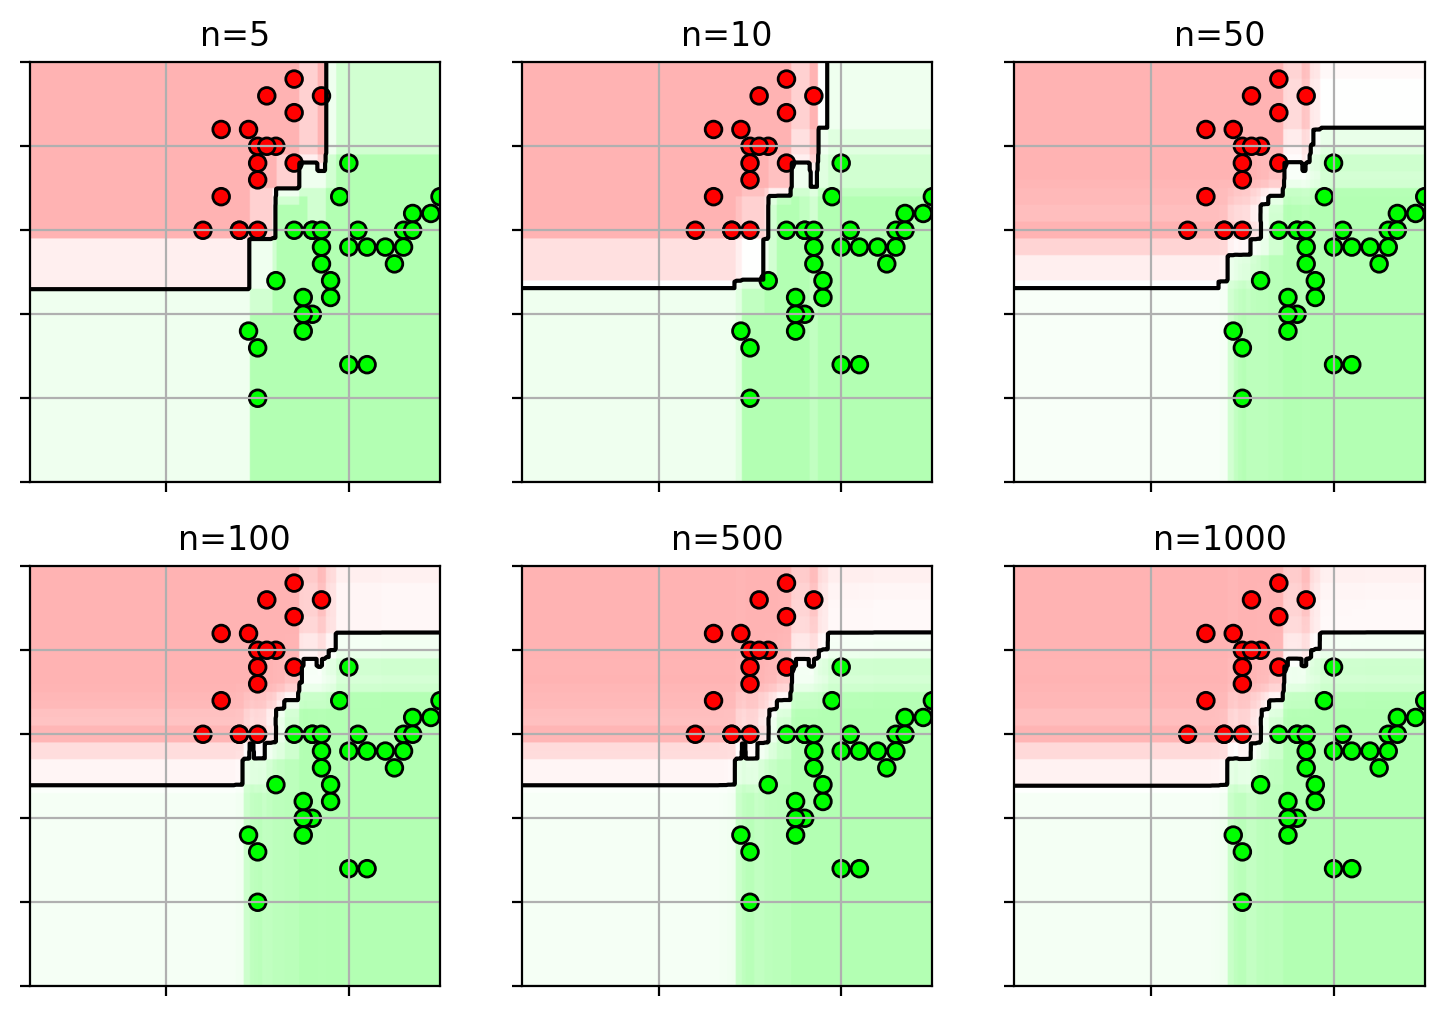
1 2 3 4 5 clfs = {} for i,n in enumerate ([5 , 10 , 50 , 100 , 500 , 1000 ]): clfs[n] = ensemble.RandomForestClassifier(n_estimators=n, random_state=4487 , n_jobs=-1 ) clfs[n].fit(trainX, trainY)
1 2 3 4 5 6 7 8 9 10 rfnfig = plt.figure(figsize=(9 ,6 )) axbox = [2.5 , 7 , 1.5 , 4 ] for i,n in enumerate ([5 , 10 , 50 , 100 , 500 , 1000 ]): plt.subplot(2 ,3 ,i+1 ) plot_rf(clfs[n], axbox, trainX) plt.scatter(trainX[:,0 ], trainX[:,1 ], c=trainY, cmap=mycmap, edgecolors='k' ) plt.gca().xaxis.set_ticklabels([]) plt.gca().yaxis.set_ticklabels([]) plt.title("n=" + str (n)) plt.close()
1 2 3 4 5 6 predY = clfs[1000 ].predict(testX) acc = metrics.accuracy_score(testY, predY) print ("test accuracy =" , acc)
test accuracy = 0.98
1 2 3 4 5 6 7 8 9 10 11 12 13 14 15 16 17 18 19 axbox = [2.5 , 7 , 1.5 , 4 ] ifig3 = plt.figure(figsize=(9 ,4 )) plt.subplot(1 ,2 ,1 ) plot_rf(clfs[1000 ], axbox, trainX) plt.scatter(trainX[:,0 ], trainX[:,1 ], c=trainY, cmap=mycmap, edgecolors='k' ) plt.xlabel('petal length' ); plt.ylabel('sepal width' ) plt.gca().xaxis.set_ticklabels([]) plt.gca().yaxis.set_ticklabels([]) plt.title("training data" ) plt.subplot(1 ,2 ,2 ) plot_rf(clfs[1000 ], axbox, trainX) plt.scatter(testX[:,0 ], testX[:,1 ], c=testY, cmap=mycmap, edgecolors='k' ) plt.xlabel('petal length' ); plt.ylabel('sepal width' ) plt.gca().xaxis.set_ticklabels([]) plt.gca().yaxis.set_ticklabels([]) plt.title("testing data" ) plt.close()
Important parameters for cross-validation
max_features - maximum number of features used for each splitmax_depth - maximum depth of a decision treemin_samples_split - minimum fraction of samples to split a node.min_samples_leaf - min fraction of samples in a leaf node.
1 2 3 4 5 6 7 8 9 10 11 12 13 14 15 16 17 18 paramsampler = { 'max_depth' : stats.randint(1 ,5 ), 'min_samples_split' : stats.uniform(0 ,0.5 ), 'min_samples_leaf' : stats.uniform(0 ,0.5 ), } rfrcv = model_selection.RandomizedSearchCV( ensemble.RandomForestClassifier(n_estimators=100 , random_state=4487 , n_jobs=-1 ), param_distributions=paramsampler, random_state=4487 , n_iter=1000 , cv=5 , verbose=1 , n_jobs=-1 ) rfrcv.fit(trainX, trainY); print ("best params:" , rfrcv.best_params_)
Fitting 5 folds for each of 1000 candidates, totalling 5000 fits
best params: {'max_depth': 4, 'min_samples_leaf': 0.013009207368046005, 'min_samples_split': 0.033821887640189785}
1 2 3 4 5 6 7 8 9 10 11 12 13 14 15 16 17 18 19 axbox = [2.5 , 7 , 1.5 , 4 ] ifig3 = plt.figure(figsize=(9 ,4 )) plt.subplot(1 ,2 ,1 ) plot_rf(rfrcv.best_estimator_, axbox, trainX) plt.scatter(trainX[:,0 ], trainX[:,1 ], c=trainY, cmap=mycmap, edgecolors='k' ) plt.xlabel('petal length' ); plt.ylabel('sepal width' ) plt.gca().xaxis.set_ticklabels([]) plt.gca().yaxis.set_ticklabels([]) plt.title("training data" ) plt.subplot(1 ,2 ,2 ) plot_rf(rfrcv.best_estimator_, axbox, trainX) plt.scatter(testX[:,0 ], testX[:,1 ], c=testY, cmap=mycmap, edgecolors='k' ) plt.xlabel('petal length' ); plt.ylabel('sepal width' ) plt.gca().xaxis.set_ticklabels([]) plt.gca().yaxis.set_ticklabels([]) plt.title("testing data" ) plt.close()
1 2 3 4 5 6 predY = rfrcv.predict(testX) acc = metrics.accuracy_score(testY, predY) print ("test accuracy =" , acc)
test accuracy = 0.98
Random Forest Summary
Ensemble Classifier & Training:
aggregate predictions over several decision trees
trained using different subsets of data, and different subsets of features.
Advantages
non-linear decision boundary.
can do feature selection.
good generalization.
fast.
Disadvantages
can be sensitive to outliers
based on trees – cannot well represent “diagonal” decision boundaries.
Author:
hhgw
License:
Copyright (c) 2023 CC-BY-NC-4.0 LICENSE
Slogan:
There is no fate but what we make.
