python可视化2——基于pyecharts库
Echarts 是百度开源的一个数据可视化JS 库。
pyecharts 是一个用于生成 Echarts 图表的类库,是 Echarts 与 Python 的对接。
·参考网站https://pyecharts.org/#/zh-cn/intro 具体功能还需参考介绍文件。pyecharts库的安装:pip install pyecharts
·安装pyecharts指定版本:python -m pip install pyecharts==1.6.2
·v1版本只支持python3.6+
例1-1 成绩柱状图
先给一个例子

1 | from pyecharts.charts import Bar |
输出为一个html文件,打开后如下:

—-注意到—-
InitOpts:初始化配置项
class InitOpts(
# 图表画布宽度,css 长度单位。
width: str = “900px”,
# 图表画布高度,css 长度单位。
height: str = “500px”,
# 图表 ID,图表唯一标识,用于在多图表时区分。
chart_id: Optional[str] = None,
# 渲染风格,可选 “canvas”, “svg”
renderer: str = RenderType.CANVAS,
# 网页标题
page_title: str = “Awesome-pyecharts”,
# 图表主题;
# pyecharts 提供了 10+ 种内置主题,开发者也可以定制自己喜欢的主题,开发文档的进阶话题-定制主题有相关介绍。
# 内置主题包括【LIGHT DART CHALK ESSOS INFOGRAPHIC MACARONS PURPLE_PASSION ROMANTIC SHINE VINTAGE WALDEN WESTEROS WONDERLAND 】
theme: str = “white”,
# 图表背景颜色
bg_color: Optional[str] = None,
# 远程 js host,如不设置默认为 https://assets.pyecharts.org/assets/“
js_host: str = “”,
# 画图动画初始化配置,参考
global_options.AnimationOpts animation_opts: Union[AnimationOpts, dict] = AnimationOpts(),
)
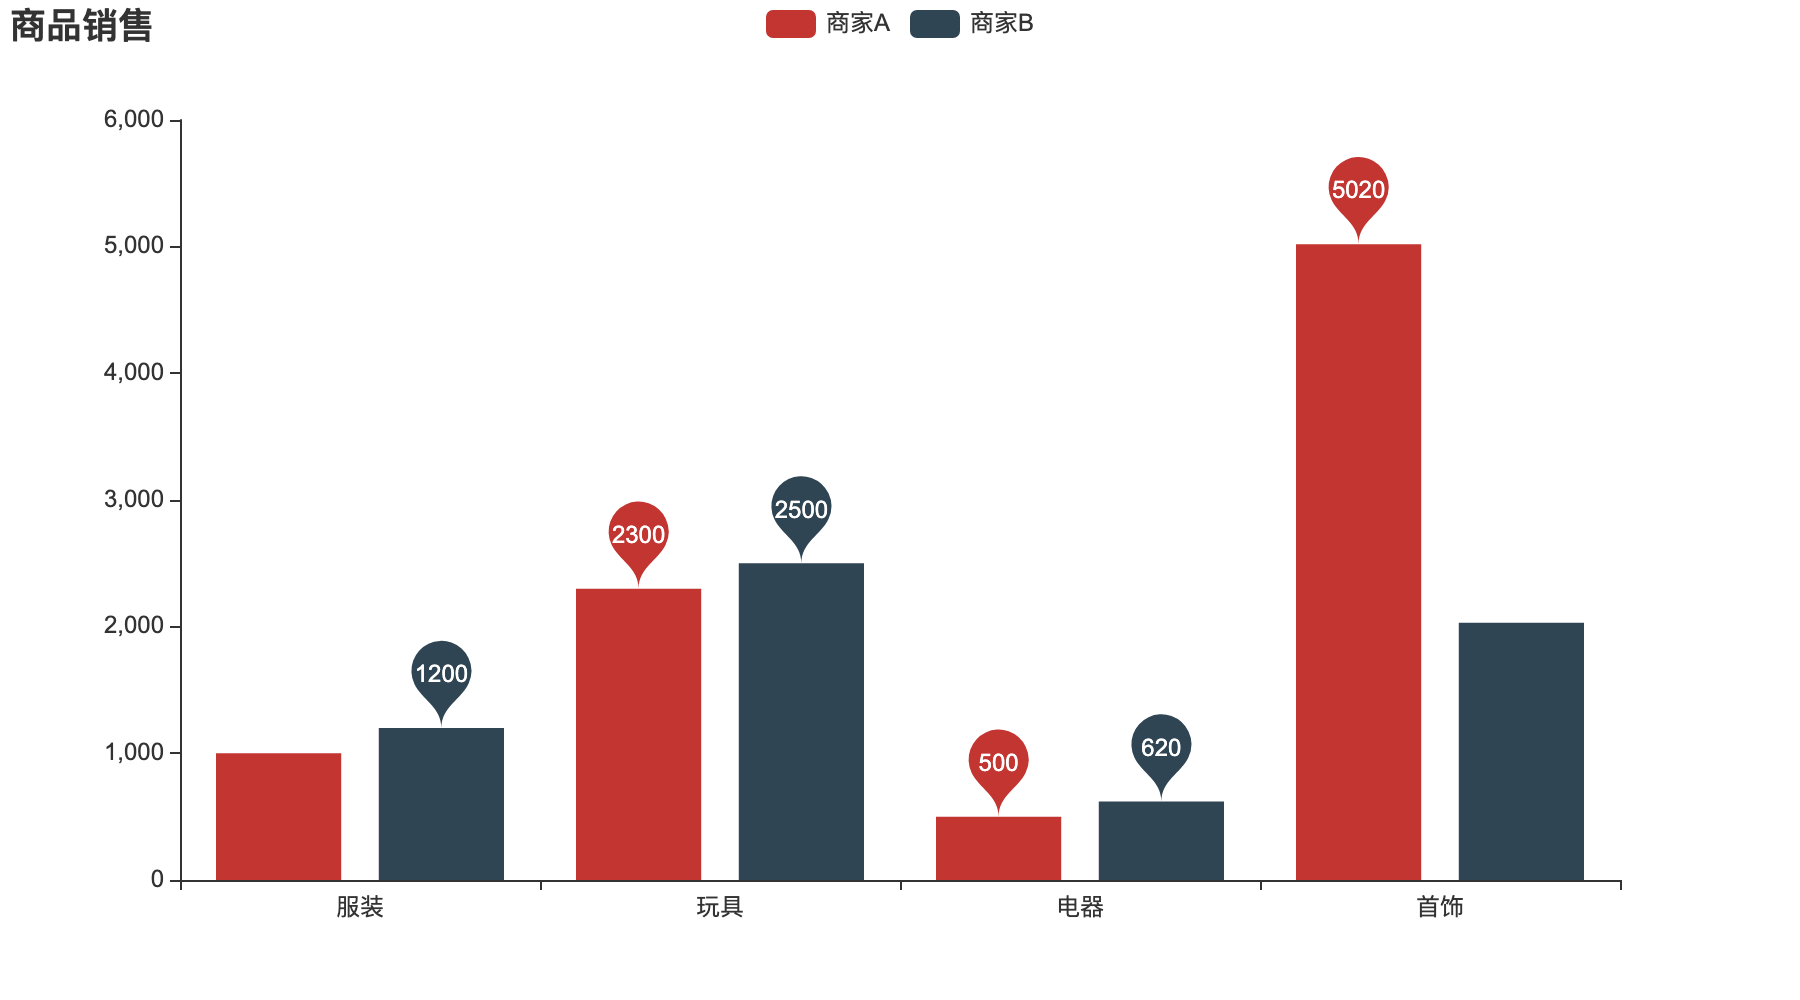
例1-2 添加图例和数据标记
题外话:
python – 定义函数 def 后面的 ->,:表示的含义
-> 常常出现在python函数定义的函数名后面,为函数添加元数据,描述函数返回的类型。
: 表示参数的类型建议符
示例:
2
3
4
5
if(x>y):
return True
else:
retur False这里,表明了函数的参数传入为int类型,输出的类型为bool类型。
1 | from pyecharts.charts import Bar |
输出结果:

将鼠标移动到图标上可以显示详细信息:
输出图片格式的两种方法
chromedrive
一般截图就好了,如果要批量输出或者自动化输出图片格式,需要用pyecharts-snapshot插件。还需要配合Chrome浏览器对应的chromedriver。(爬虫我记得也用到了这个)
- 安装 pyecharts-snapshot
pip install pyecharts-snapshot
pip install snapshot-selenium
安装对应的chrome浏览器对应的Chromedriver(版本必须对应当前浏览器的版本) 下载地址:
http://chromedriver.storage.googleapis.com/index.html?path=80.0.3987.16/
http://chromedriver.storage.googleapis.com/index.html再将其解压到指定路径,将该路径添加到用户的环境变量path路径下,否则报错:
'chromedriver' executable needs to be in PATH.
- 导入库
from pyecharts.render import make_snapshot
from snapshot_selenium import snapshot
- 设置输出为图片格式
make_snapshot(snapshot, bar1().render(),”filename.png”)
mac添加Chromedriver
1.下载对应版本的驱动器
http://chromedriver.storage.googleapis.com/index.html
2.驱动器放在python的安装目录下
a.找到python的安装路径,一般是/usr/local/bin/python3
终端输入which python,可以查出路径
Mac下/usr/local目录默认是对于Finder是隐藏,如果需要到/usr/local下去,打开Finder,然后使用command+shift+G,在弹出的目录中填写路径就可以了
b.把驱动器放在同目录下
3.配置环境变量
打开终端
输入vi ./.bash_profile回车
输入i进入编辑模式
添加环境变量export PATH=$PATH:/usr/local/bin/chromedriver
点击“esc键,退出insert模式”, 然后输入“:wq!”,回车,保存成功
输入“source ./.bash_profile”,让环境变量生效
输入”echo $PATH”,查看环境变量,发现添加成功
4.赋予权限
sudo chmod u+x,o+x /usr/local/bin/chromedriver
在例1-2结尾添加:
1 | from pyecharts.render import make_snapshot |
输出结果:

Node.js
还有第二种方法,大致流程(win)如下(我没有试过):
第一步:下载并安装Node.js
下载链接:https://nodejs.org/en/download/
第二步:启动Node.js command prompt,安装phantomjs
c:\user\hhgw>
npm install -g phantomjs-prebuilt
npm install phantomjs-prebuilt –phantomjs_cdnurl=https://bitbucket.org/ariya/phantomjs/downloads
第三步:安装 pyecharts-snapshot
pip install pyecharts-snapshot
pip install snapshot-phantomjs
第四步:设置输出为图片格式
make_snapshot(snapshot, bar1().render(), “testBar1-3.png”)
例2 折线图
1 | from pyecharts.charts import Line |
结果如下:
例3-1 饼图